Janine Glathar arrived at Bucknell University in Lewisburg, Pennsylvania, with a mandate to integrate GIS and spatial thinking across the entire campus in both teaching and research.
Over the past seven years, she has helped faculty incorporate GIS into more than 50 courses from 22 different academic departments. In addition, more than 80 research projects that made use of geospatial technology were completed during that time.
Before Glathar’s arrival, ArcGIS had been used in the university’s geography and geology departments for research and classroom projects. Geography professor Ben Marsh is particularly interested in applying GIS to community action initiatives. “Some activities may seem random, but when you look at them spatially, you see themes,” said Marsh. “GIS maps can reveal practices or decisions that most people wouldn’t realize as systematic without this type of analysis.”
Interest in GIS began to grow among faculty members, and as a result, a core group of professors, including Marsh, started offering workshops to help other faculty incorporate the technology into their own classes and research projects.
After meeting with faculty and assessing the demand for GIS use across campus, Glathar got approval from administrators in Bucknell’s Library and IT Division for an Esri site license. She then began to determine what would be the best infrastructure to support the university’s expanding GIS initiatives. “It was clear in 2009 that everything was moving towards web-based mapping and analysis,” said Glathar. “We are very lucky at Bucknell to have a vice president of library and IT, Param Bedi, who encourages us to be creative and innovative in coming up with ways to better serve faculty and students on campus. With the support of Param and our very talented staff in systems integration, we were able to design and build a back-end ArcGIS for Server infrastructure to support our classroom and research efforts.”
Since faculty in the geography and geology departments already teach core GIS classes, Glathar is able to devote her time to championing the use of GIS, rather than working as a classroom instructor. Her activities include advising professors on the best way to implement GIS into their classes and research, conducting GIS workshops, and collaborating on a wide range of research projects with faculty and students.
“I’m currently working with a faculty member who teaches American economic history,” said Glathar. “It’s an upper-level class for economics majors, and the focus is on the regionalization of the US economy. The class is examining pre-Civil War and post-Civil War economic trends.”
Glathar showed a student assistant how to get historical census data from 1790 through 1960 and create map layers. The layers allow the visualization of the development of regional economies in the United States by examining demographic and economic census variables in relation to things like the expansion of transportation networks.
“We wanted the students in the class to examine the shift from moving goods by canal, or water transport, to moving goods by railroad, and then to the modern day road transportation networks and air travel,” said Glathar. “Studying spatial data and other factors provided a unique opportunity for the analysis of the way regional economies developed in the United States.”
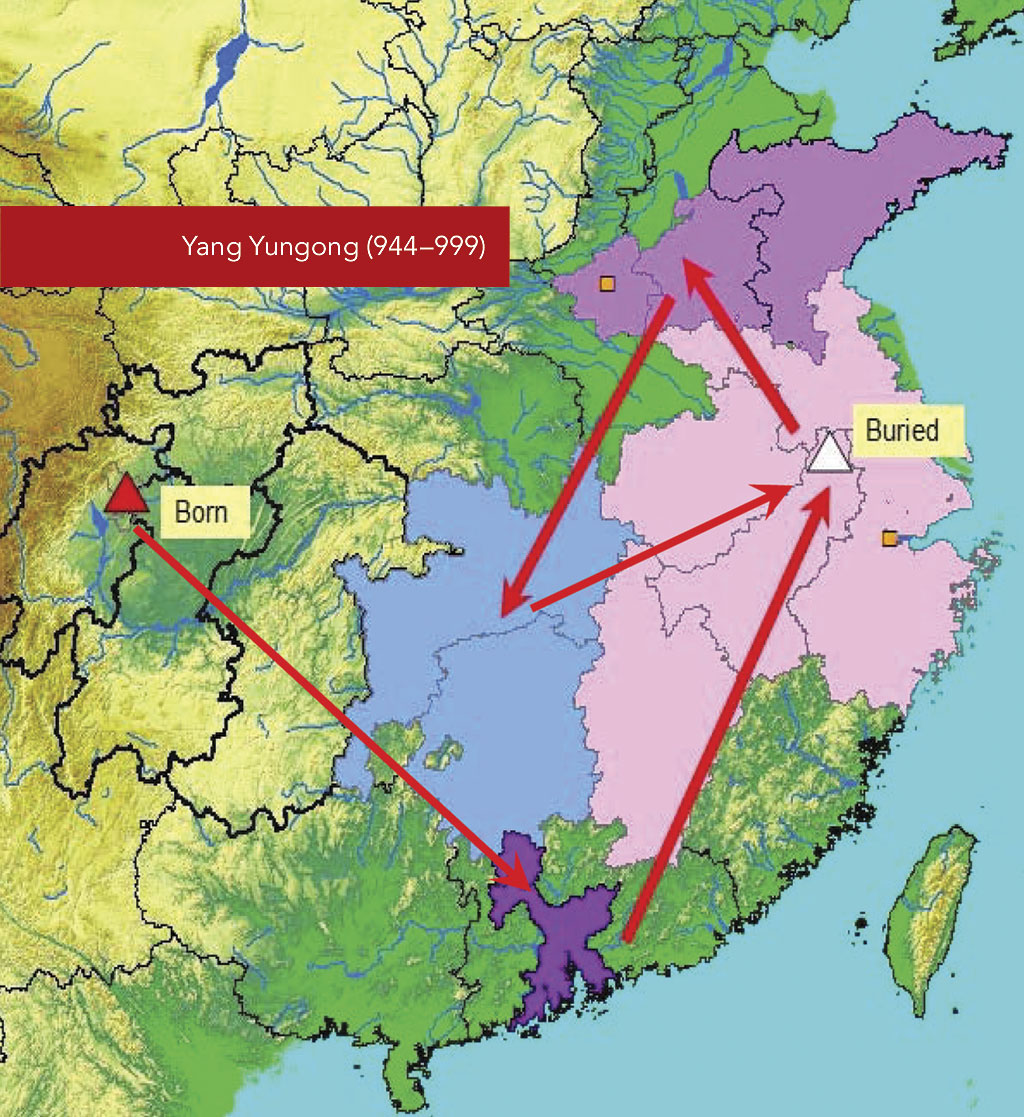
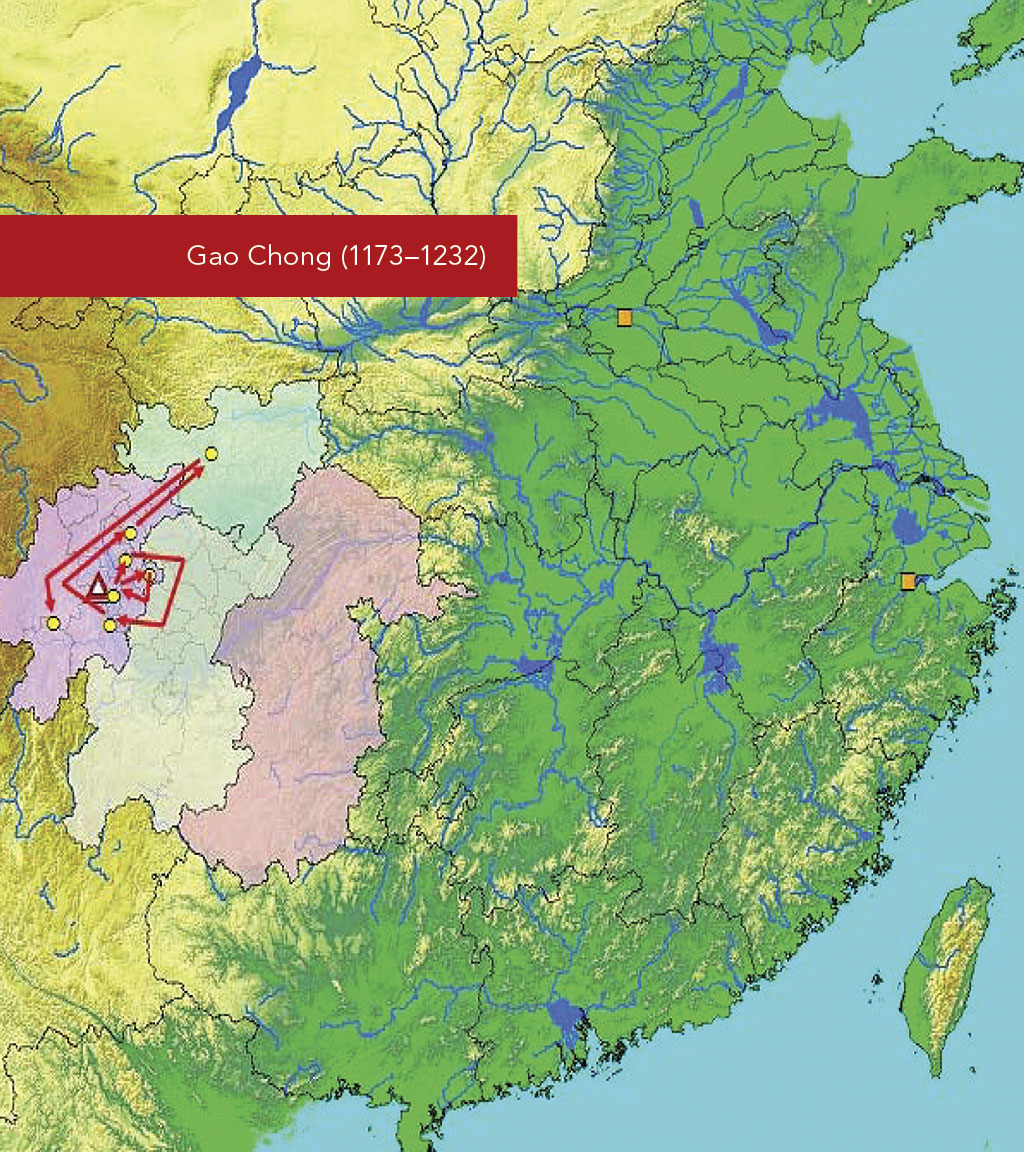
Thanks to Glathar’s efforts, GIS is already used by a number of other departments for both instruction and research at Bucknell University. Song Chen, assistant professor of Chinese history at the university, developed a geospatial dataset from a collection of several hundred funerary biographies of Chinese civil servants and their marriage networks from the 10th to the 13th centuries. He used the dataset to map their locations to better understand the relationship between the imperial state and the local government leaders of that period.
“My research combines GIS, network analysis, and prosopographical research,” said Chen. “I use GIS to map out geographical patterns of civil servants and their marriage networks. Though my recent work relies primarily on a dataset I personally built, I have also benefited significantly from other existing data collections and databases. I owe much to the China Biographical Database (CBDB) and China Historical GIS (CHGIS) projects.”
CBDB is an online relational database that contains about 120,000 historical figures. It includes a large collection of data points that can be cross-queried and exported. CHGIS provides the most complete and authoritative point and polygon files for locations in Chinese history.
Eric Faden, associate professor of film studies, teamed with student Kate Matelan, a former Ms. Wheelchair USA, to create a documentary film and map detailing Matelan’s difficulties in getting around campus in a wheelchair. This provided anecdotal evidence for the university’s Americans with Disabilities Act initiative. Matelan and an able-bodied student narrated their individual walks to the same location on campus. In addition to taking her 40 percent more time to get to class, Matelan encountered uneven pavement and a lack of routes she could safely navigate. Inside the campus building, an absence of automatic doors required backtracking along corridors to reach her destination.
Professor Richard Crago’s civil and environmental engineering class recently calculated storm water flow patterns on local farmlands by analyzing land cover with the related elevation data. This project was done with the support of the Chesapeake Conservancy in an effort to devise watershed protection strategies for the Buffalo Creek watershed, which ultimately flows into the environmentally threatened Chesapeake Bay 100 miles to the south.
“The Chesapeake Conservancy taught us how to use aerial imagery and elevation data to create extremely high-resolution land-cover classification data,” said Glathar. “With one-meter land cover classification data instead of the typical 30-meter resolution, you can pinpoint much more precisely what is happening in a given area and make better, more effective decisions.”
The goal of this project is to identify those areas that have the greatest negative impact on the local environment and engineer solutions to mitigate that impact. This includes the creation of retention ponds bordered with vegetation to build buffers within the watershed. The conservancy calls this process precision conservation.
GIS use has spread across the university’s departments. The biology department uses GIS for mapping species distribution in the Sudan. In the chemistry department, students measure the plumes of flow-back water used to extract natural gas from shale and test it for high salinity levels, radioactive elements, and toxic trace metals. Physics and computer science students teamed to create a drone to collect high-resolution aerial imagery that was combined with elevation data to map a creek that runs through the university. The subsequent analysis will be used for restoration and flood control purposes. Women’s and gender studies students recently used GIS to map the occurrence and concentrations of sexually exploitive advertising in Brazil, United States, China, Thailand, India, and South Korea.
“At Bucknell we are not focused on providing technical training in how to use GIS from A to Z, but rather in how to help people ask and answer spatial questions,” concluded Glathar.
About the author