The ArcGIS Spectral Index Library introduces a streamlined option for visualizing your imagery using spectral indices. Spectral indices are combinations of the pixel values from two or more spectral bands in a multispectral image. Spectral indices are designed to highlight pixels showing the relative abundance or lack of a land-cover type of interest in an image.
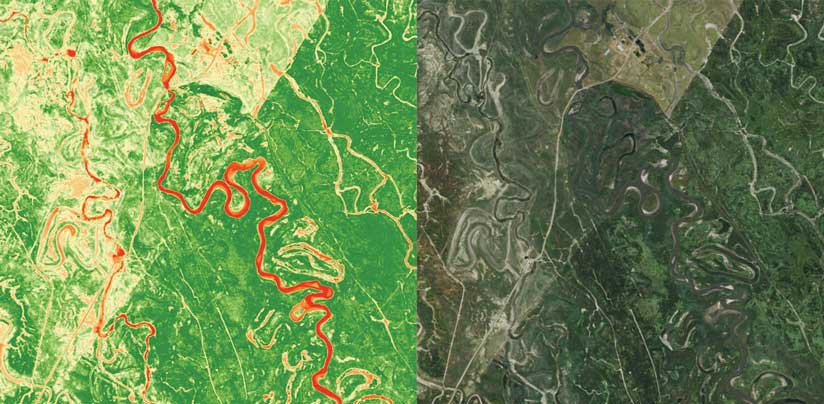
The most common index is the Normalized Difference Vegetation Index (NDVI), which provides an indication of abundance of vegetation by comparing the different reflectance values of the red and near-infrared bands (normalized such that the minimum value is -1.0, and the maximum is +1.0). There are many other indices that have been developed, using a variety of spectral bands to highlight different phenomena, such as vegetation, water, snow, and soil.
Spectral indices are most commonly applied in ArcGIS using raster functions.
Out-of-the-box functions, such as NDVI, Soil Adjusted Vegetation Index (SAVI), and Enhanced Vegetation Index (EVI), are available. The Indices button on the Imagery tab in ArcGIS Pro provides a handy shortcut to a predefined list of about 20 indices that are designed to process data locally.
Users can also implement their own band ratios and combinations using the Calculator or Band Arithmetic raster function.
The ArcGIS Spectral Index Library offers ready-to-apply spectral indices using raster functions that are easy to use.
[See also “Imagery Superpowers—Raster analytics expands imagery use in GIS” in the spring 2018 issue of ArcUser.]
ArcGIS Spectral Index Library
ArcGIS Online houses the Spectral Index Library, which contains raster function templates for a variety of well-known indices. For each index, there are typically two raster function templates: one that produces a single-band image in floating-point format that’s appropriate for analysis and a second that applies a color ramp or color map to generate a colorized image intended for visual representation.
These raster templates can be applied to your imagery in ArcGIS Pro or in the Map Viewer in your ArcGIS Enterprise portal. The library of functions is accessible through the public ArcGIS Online group ArcGIS Spectral Index Library. You can join the group for easy access to the indices.
Within ArcGIS Pro, these spectral indices can be applied to local imagery, applied to imagery from an image service, or you can transmit the definition of the index to the server. Transmitting (or uploading) the definition of the index to the server is advantageous because the server performs the processing on the source data and returns only the more compact index back to the client, increasing performance.
How Do You Benefit from the Spectral Index Library?
ArcGIS Pro natively provides multiple ways to apply indices. These options include the Band Arithmetic raster function (available through the Raster Functions pane), the Indices gallery on the Imagery tab, or using the Calculator raster function to manually implement your own custom algorithm.
However, in addition to ease of access and convenience when applying these indices using the Spectral Index Library, there are three other benefits:
The Spectral Index Library selects the appropriate bands for you. The Band Arithmetic function requires you to know your imagery bands or imagery wavelengths to use the function out of the box to apply spectral indices.
With the Spectral Index Library, you can easily perform server-side processing without having to modify or tweak any parameters. The built-in system functions cannot be used for server-side processing unless you pick the index, specify the band numbers or wavelengths, define the raster variable, and explicitly save the Band Arithmetic function as a custom function template. The functions provided in the indices gallery can only be applied on the client and cannot be used for server-side processing. Without the Spectral Index Library, you must know what you are doing and go through multiple steps to apply a server-side index.
The visual indices in the ArcGIS Spectral Index Library have a custom stretch and a color map to render the visual products intuitively. These custom parameters are specifically tweaked for each index for better visualization of specific phenomena.
The big benefit of using the Spectral Index Library is convenience. Select your imagery, pick the spectral index from the library, and click Apply. Voila! You have the product you desire. It’s that easy.
About the authors

Vinay Viswambharan