Using GIS to comply with state and federal regulations led a sewer utility to develop a greatly improved maintenance program that intelligently prioritizes work on its system based on business risk.
In 2005, Sanitation District No. 1 of Northern Kentucky (SD1) entered into a consent decree with state and federal environmental regulators to address overflows in Northern Kentucky’s wastewater collection system that generally occur during wet weather events and to ensure compliance with the Clean Water Act.
SD1 is a regional sewer utility that serves three of the northern-most counties in Kentucky. The settlement, negotiated among the US Environmental Protection Agency (EPA), Kentucky’s Environmental and Public Protection Cabinet, and Sanitation District No. 1, calls for a 20-year plan to improve the area’s waterways by addressing raw sewage overflows from the combined and separated sewer systems within SD1’s service area.
As part of the consent decree, SD1 entered the capacity, management, operations, and maintenance (CMOM) program. This program states that SD1 must inspect all sewer pipes once every 10 years. Prior to entering the consent decree, SD1 operated with a relatively reactive approach. It inspected only problem pipes or pipes in areas with known issues. Naturally, as the number of inspected pipes increases, the number of known pipe-related issues increases. This additional information about the condition of the system makes for a very busy maintenance program.
What Are the Consequences?
Historically SD1’s maintenance program was driven by a probability of failure (POF) score. It can be closely compared to the more commonly known Pipeline Assessment Certification Program (PACP) score. PACP is a score of the pipe’s structural condition based on a visual coding assessment. When a pipe fails, the flow stops. The POF score indicates how likely it is that this will happen.
With the assessment program maturing and over 50 percent complete, there was a need for a more refined assessment of the overall risk. Over 50 percent complete meant that SD1 had more than 27,000 pipes with a POF score. Prioritizing rehabilitation schedules became time-consuming and overwhelming, especially when trying to take into account the impact of a pipe failure on the community.
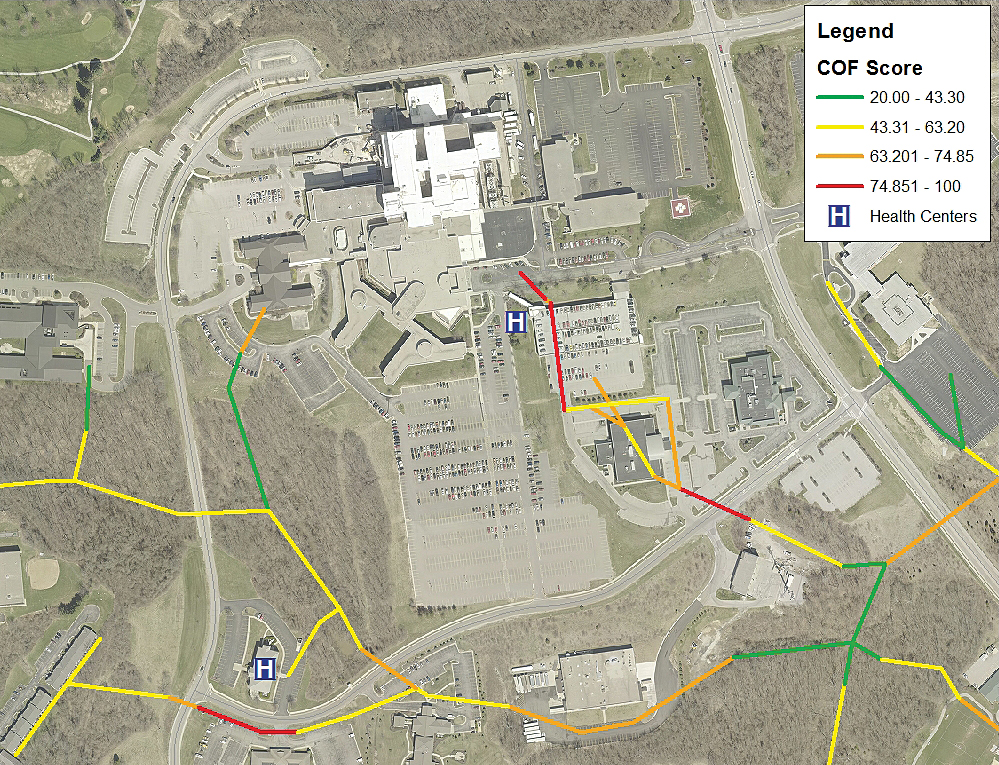
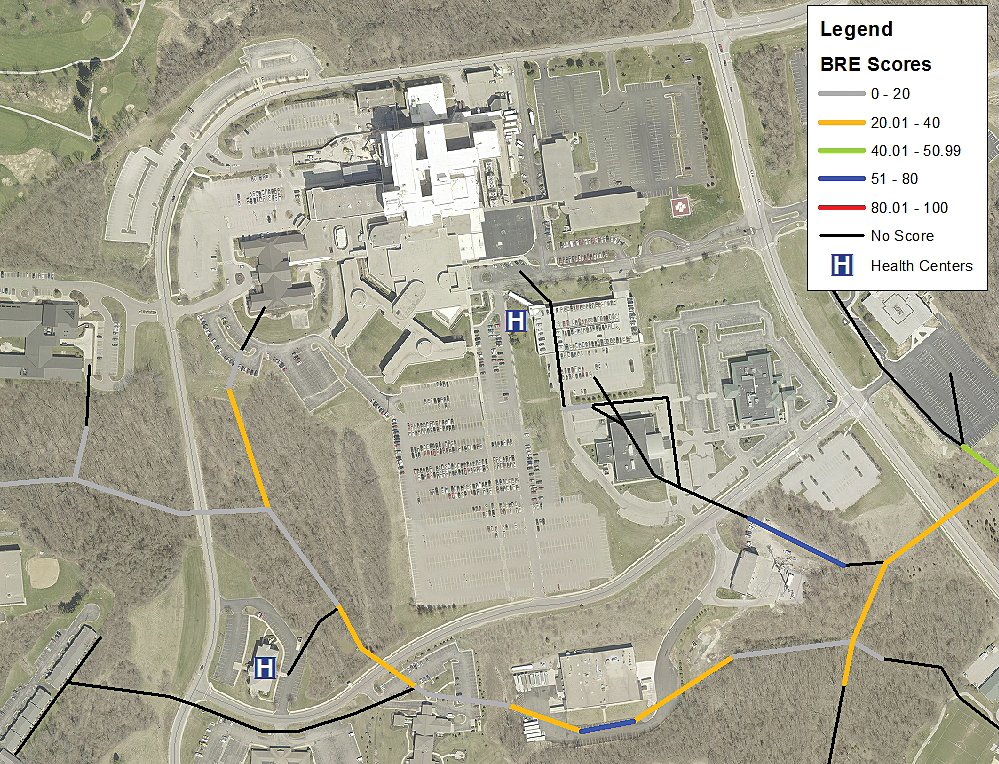
The decision was made to generate a business risk exposure (BRE) score for all pipes. A BRE score calculates the nature and level of exposure that an organization is likely to confront if a specific asset or group of assets fails. To generate a BRE score, the POF score is combined with a consequence of failure (COF) score. The COF was the only missing puzzle piece. As defined by the US EPA, the COF score is the real or hypothetical results associated with the failure of an asset. In other words, the COF score establishes the level of impact each asset would have on the community if it were to fail.
Laying a Strong Foundation
A building is only as strong as the foundation it is built on. This is true with regard to work processes as detailed as determining the COF. If the data collection and calculation procedure is strong, the overall result will be solid. With this principle in mind, SD1 began the COF data process by breaking the project down into several phases: setting categories and collecting, processing, and scoring data.
The first phase involved choosing the categories that would provide the basis for the overall criticality of the pipe asset. With the aid of a local consultant, the categories chosen were cost, social/health, and environmental. Each category consisted of specific criteria. For example, diameter, depth, surface, and overflow backup were the critera assigned to the cost category. This first phase provided the driving force behind the other phases of the process.
Data Collection
In the next phase, local and state resources were used to collect all the data needed to successfully run the COF. The geospatial locations of police, school, fire, and hospital buildings were necessary to calculate the proximity of each pipe asset to each building. Having this data in place was very helpful and contributed to a strong foundation for the COF process.
Geoprocessing with ModelBuilder
With the foundation laid and data collected and stored, it was time to begin the processing phase. This phase had two main objectives: figure out the most efficient way to process the data and accomplish processing in a manner that could easily be repeated at regular intervals. ModelBuilder, a component of ArcMap in ArcGIS for Desktop, satisfied both of these goals.
Using ModelBuilder, a variety of geoprocessing tools were strung together to create complex processes that built on successive results. For example, the Near geoprocessing tool was used to collect attributes such as the distance of a pipe asset from a school, railroad, or park. With this data, a score was created based on an asset’s proximity to a critical feature. The closer an asset was to a critical feature, such as a school, the higher the score it received because the consequences of pipe failure would be more significant.
Scoring with ModelBuilder
As mentioned previously, the COF process used three categories: cost, social/health, and environmental. These categories employed nine criteria. In this phase, attributes were associated with criteria using geoprocessing tools and ModelBuilder. Based on those attribute values, scores between 1 and 5 were assigned, with 5 representing the highest consequence of failure. For example, pipe diameter was a criteria in the cost category. Pipes that were 8 inches or less in size were given a score of 1, whereas pipes that were greater than 36 inches were given a score of 5.
Next, using the Calculate Features geoprocessing tool and ModelBuilder, each criteria was scored and weighted. The criteria of each category was then totaled and weighted to give each category a weighted score. A combination of weighted criteria scores and weighted category scores was used to calculate an overall COF score. This COF score was then added to the POF score to yield the final result, a BRE score.
Overcoming Obstacles
For any process to run well, data consistency, data integrity, and data accuracy are vital characteristics. During the COF process, SD1 met a few obstacles that had to be overcome so the entire dataset would possess these qualities.
Data Consistency
As a regional sewer utility, SD1 relies on geospatial data from three separate sources. These sources sometimes arrange data differently. The ArcGIS Data Interoperability extension was used to make the data consistent for internal users and data processes such as the COF.
Data Integrity
Two of the criteria the COF relied on were diameter and depth. While pipe assets generally contain these two attributes, a number of assets had zero values for either one or both of these fields. By creating models that used geoprocessing tools such as Select Layer by Location and Summary Statistics, this problem was overcome. The model selected each zero-value pipe, and then selected the pipes within a 100-foot buffer of the zero-value pipe to summarize the average depth or diameter of those pipes within the buffer. Next, using the Get Field Value tool, the average value was grabbed from the summary table. That average value replaced the zero value, thus giving satisfactory data for the COF criteria.
Data Accuracy
Another model gave each building in the SD1 service area an elevation value. The model ran the Spatial Join tool combining the fields from the contour layer, which held elevation values, and the building layer. However, the resultant data contained a number of buildings that lacked elevation values because the building polygon had not intersected a contour line. This was solved by modifying the existing model by adding a For iterator so the model ran a total of six times. Each time it ran, the model used the values 0-50, iterating by intervals of 10, for the Within a distance of option in the Spatial Join tool. The output yielded building elevations for the vast majority of buildings, thus satisfying this piece of the COF process.
Present and Future Uses
Combining the score data generated from the COF process with the existing POF data created a BRE score for the pipe assets. Now equipped with this score, the Asset Management team at SD1 has been using this data since June 2014 to make more informed decisions with regard to rehabilitation and maintenance of SD1 assets.
Being able to tackle a project of this magnitude using in-house staff aided by GIS technology contributed to the success of this process. The power behind a tool like ModelBuilder shows what any GIS user—with a little training, time, and backing from upper management—can accomplish.
SD1 plans to expand this process to all company assets. After all assets are inventoried, SD1 will use this same process to create a district-wide business risk assessment. This will be used to aid in decision making during SD1’s budget season with the goal of identifying which departments are at a greater risk so funds can be budgeted accordingly.
For more information, contact Jerry Biedenbender at 859-547-1655 or Jordan Hamm at 859-578-6761.
About the authors