This article, the third in a series on GIS return on investment (ROI), provides ROI examples and offers a summary of findings after two years of using this ROI approach at the Utah Department of Natural Resources.
In an article in the Winter 2016 issue of ArcUser, I addressed the need for and benefits of documenting GIS results as well as the advantages of adopting the right ROI mind-set. In “Downsizing the ROI Report” in the Spring 2016 issue, I reviewed the target audience for ROI reports, shared a different approach to documenting ROI, and provided a one-page ROI and Benefits Report template that could be downloaded from the online version of the article.
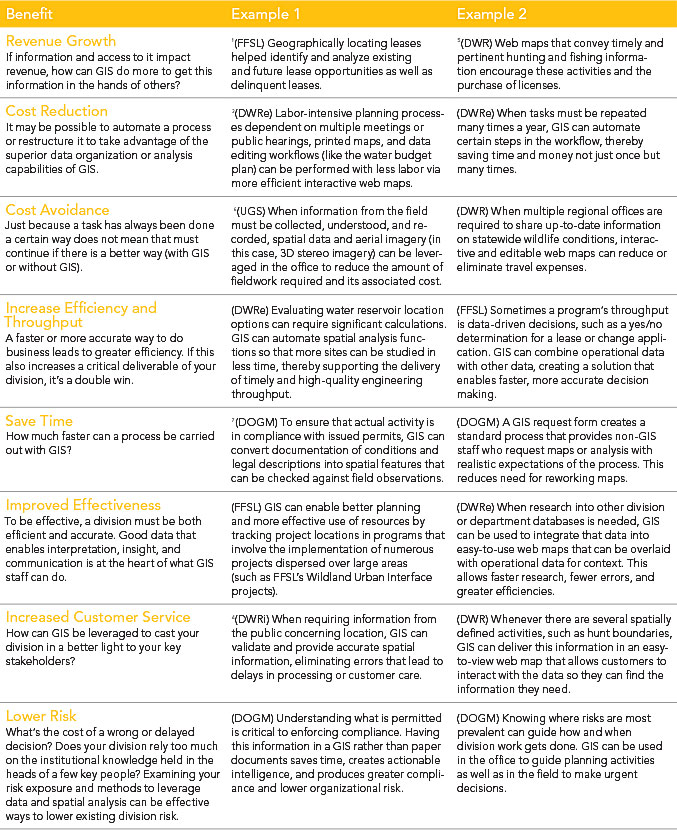
The online version of this article has links to two reports created using the template. They are referenced in case you want to download them. Look at the ROI and Benefits Report for the Wildland Urban Interface (WUI) Project Geodatabase Compilation project carried out by the Division of Forestry, Fire, and State Lands (FFSL). The Executive Summary portion notes that not all the organization’s relevant information could be used to make decisions. The Tangible Benefits section of this same report describes how a repeatable method for producing more timely, higher-quality data is now part of the organization’s decision-support process.
Your leaders need to know the bad and the ugly of your current information and process limitations so they can accurately assess the good your GIS efforts are delivering. This report describes efforts to improve an outdated workflow. This problem is not an uncommon one for organizations, especially those with dispersed offices, multiple data editors, and an absence of data standards. This report also deftly describes the current and proposed workflows by describing details that the GIS staff in other departments can understand, learn from, and then apply.
The 60 hours required by this project to clean and organize years of data reduced the original 10-hour, unstructured job that had a high risk of error to a 12-minute, easy-to-repeat task that had the added benefit of standardizing the data. The fact that the task was repeated numerous times throughout the year and produced both ROI and tangible benefits made this GIS enhancement a no-brainer.
The measures of success at the bottom of this report are critical components of the report because they do two essential things. First, they describe the actions necessary to assess and validate the report’s initial assumptions. Even if leadership doesn’t ask for this information, the GIS professional should be compelled to discover these metrics. Second, the measurements provide expectations for the GIS professional, who should think in terms of business performance and accountability. As I stated in previous articles, ROI studies are not conducted enough in our discipline. If GIS managers don’t start having higher expectations for GIS staff performance, we will keep getting the same results.
The ROI and Benefits Report for the Statewide 3-D Stereo Model Acquisition project describes a project done by the Utah Geological Survey (UGS). I wanted to share this report for a very important reason. Its most notable benefit is cost avoidance, and that is the gift that keeps on giving.
As you can imagine, fieldwork constitutes a core activity of geologic mapping. This fieldwork, along with associated expenses for hotels, per diem, transportation, fuel, and labor, represents a significant cost of doing business for the UGS. By addressing these costs, this workflow enhancement hits a bulls-eye for the division’s bottom line. The streamlined, in-house process for creating highly accurate and standardized geologic data not only reduced the need for fieldwork—and the time and expense it requires—but also helps accelerate the completion of the division’s key deliverable: geologic information products. The tangible benefits listed in the report deliver considerable gains to the organization as well as universities and the public.
The UGS example also highlights the fact that even though the ROI calculation may be relatively low, GIS projects like this one can manifest so much positive benefit that an ROI value of some number of dollars can’t reveal all of a project’s contributions. For example, that $85,000 of cost avoidance keeps helping the division year after year. Even if the ROI was zero, or initially negative, this project suggests that the workflow improvements are still worth pursuing. Please try not to place too much emphasis on a project’s ROI value. Always look deeper into the way business operations can improve and what can come from those improvements. This was the mind-set behind naming the report the ROI and Benefits Report.
It should be noted that the ROI calculations in the template include the entire cost of the workflow so as to be reflective of all costs required to perform a given task. This produces more conservative ROI numbers. If only the cost associated with the GIS enhancement was considered in isolation, the ROI would be considerably higher. For example, using the formula savings minus enhancement cost divided by enhancement cost would generate a future annual ROI of 459 percent for the UGS project compared to the 45 percent shown.
I want to thank Sean Edwards of FFSL and Kent Brown of UGS for allowing me to share their ROI and Benefit Reports and for their excellent work in documenting their results. So far, Utah DNR has completed more than 30 ROI and Benefit Reports in the last two years, and the cumulative statistics gathered from tracking GIS ROI and benefits are shown in Table 1.

To convey the business benefits delivered as part of DNR’s GIS results documentation effort, I summarized our deliverable benefits (shown in Table 2) and distributed this information to our department and division leadership.
These examples of ROI and Benefit Reports will help you understand how GIS projects can improve organizational operations and realize the value of those improvements to the organization. I hope you can also appreciate not only the reasonable level of effort required to complete the abbreviated documentation of results required by the ROI and Benefits Report, but also how uniquely positioned GIS is to transform your organization’s business processes.
About the author