In 2004, marine researchers from 10 countries teamed up for an ambitious three-year effort to collect genetic samples from as many humpback whales as possible across the width and breadth of the northern Pacific Ocean. They created photoidentification records for each sighted humpback and recorded the geolocation of each sighting.
Researchers hoped the effort, which involved 400 biologists working on 50 teams, would lead to discoveries about the population structure and genetic diversity of humpbacks—a species once hunted to the brink of extinction—as well as their migration patterns.
Dubbed SPLASH (Structure of Populations, Levels of Abundance and Status of Humpbacks), the $3.7 million research effort was funded by the National Oceanic and Atmospheric Administration (NOAA), the Canadian government, and private sources. SPLASH was coordinated by the Olympia, Washington, nonprofit organization Cascadia Research Collective.
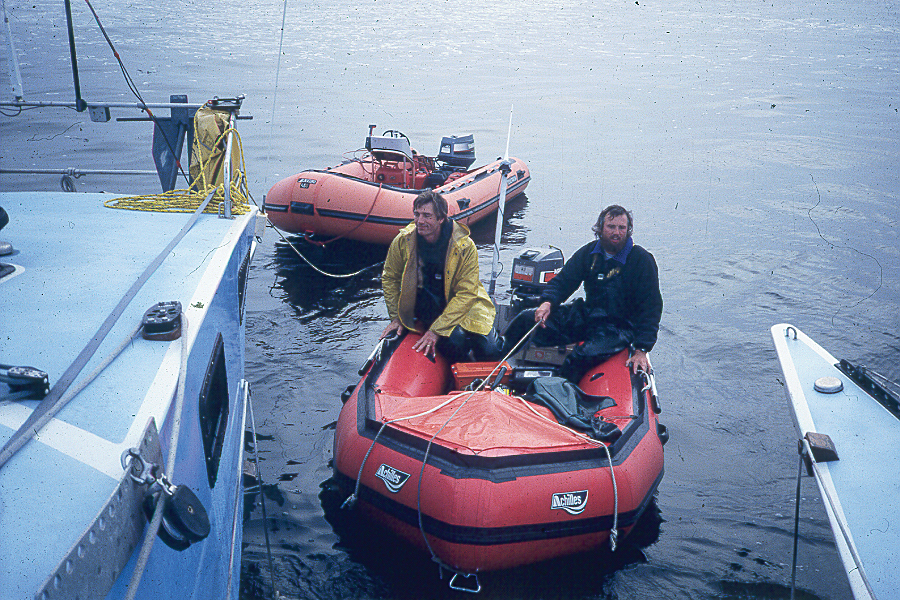
Researchers working in vessels ranging from oceangoing ships to canoes produced an abundance of data. Thousands of DNA samples and images collected in the whales’ tropical breeding grounds and in their higher-latitude feeding grounds off the coasts of Russia, Alaska, British Columbia, and other locations, led to the identification of 8,000 individual humpbacks.
Four years ago, the task of mapping this data fell to Oregon State University (OSU) PhD candidate Dori Dick, a GIS specialist who was completing her doctorate in earth, ocean, and atmospheric sciences. Working with Office of Naval Research (ONR) funding acquired by Esri chief scientist Dawn Wright and OSU professor Scott Baker, Dick developed an ArcGIS extension called geneGIS for viewing and analyzing SPLASH data. [ONR is an executive branch agency of the Department of Defense that provides technical advice to the Chief of Naval Operations and the Secretary of the Navy.]
“It’s a natural thing when I have data. I want to map it right away and visualize what the data are showing me,” Dick said. “When I received the [humpback] data, mapped it in GIS, and realized no one had ever seen it mapped before, what I saw was stunning.”
Analysis of the photographic, DNA, and geolocation data led to dramatic discoveries about humpbacks’ movements and genetics, as well as the very nature of the species’ northern Pacific population.
A Cultural Inheritance
Humpback calves are born in tropical breeding and calving grounds in the winter and then follow their mothers to northern latitudes to feed for the summer. Come winter, mother-calf pairs then return to the tropics, where calves are weaned. SPLASH photo and DNA identifications, paired with geolocation data, showed that, as adults, those calves return to the same northern feeding grounds to which their mothers introduced them.
“We’re now confident it’s a matter of maternally inherited fidelity,” said Baker, who teaches in OSU’s department of fisheries and wildlife and serves as the associate director of the school’s Marine Mammal Institute. The institute conducted genetic analysis for the SPLASH project and mainained the resultant DNA database. “In that first year of life, because of that maternal dependency, calves learn a migratory route and specific destinations, then return year after year, even though they’re capable of learning other routes—we have seen some wander. This is not a genetic inheritance but a cultural inheritance.”
Mapped sightings of DNA-profiled individuals also revealed previously unforeseen population complexities. There is greater genetic diversity in feeding grounds than in breeding grounds, which suggests that the population of a given breeding area can disperse to multiple feeding zones.
“Whales from Hawaii might spend the summer feeding off southeast Alaska,” Baker explained. “But others from that same breeding ground might feed further north, off the Gulf of Alaska, or toward the Aleutian Islands. Even though they’re part of the same breeding population, they’ll spend more than half the year in different habitats.” Understanding this behavior remains a challenge that is being addressed using ArcGIS.
Changing Conservation Practices
This discovery has dramatic implications for conservation efforts. For instance, protective strategies built solely on understandings of breeding ground populations will fail to account for the humpback population’s genetic diversity and the species’ actual use of its environment.
Perhaps most startling, DNA analysis also revealed the possibility of five genetically distinct northern Pacific humpback populations, each with a unique geographic distribution. In the United States, humpbacks are classified as endangered under the Endangered Species Act of 1973 but do not enjoy similar protection globally. The species is categorized as being of “least concern” by the International Union for the Conservation of Nature, an organization based in Switzerland that has substantial influence on environmental policies worldwide. The potential redefinition of the northern Pacific humpback demography as five smaller and distinct populations, Baker has suggested, could lead to strengthened protection for the whales under US and international regulations.
“If there are listings or delistings of populations, each one needs to be considered independently,” Baker explained. “Each has a different history.”
The humpback’s status as an endangered species has made it the object of research for generations of marine biologists. In the first half of the 20th century, humpbacks were hunted to such an extent that the global population dropped by an estimated 90 percent. An International Whaling Commission ban on hunting humpbacks, first put in place in the 1960s, is still in effect. The humpback population worldwide is now believed to be approximately 80,000, with a quarter of those whales in the north Pacific.
Past Paucity of Data
Biologists working to improve the species’ chances for recovery have long been hampered by a lack of reliable data on humpback numbers, habitats, and migration patterns. Prior to the widespread availability of GPS technology, researchers and whalers alike documented humpback sightings, but information was recorded inconsistently and often with only vague geographic references. Without DNA analysis to confirm familial connections, researchers had to rely solely on firsthand observations of humpback cows and calves. The accuracy of the subsequent sighting of individual whales relied on guesswork to some degree.
“There hasn’t been a good understanding of whether the population units suggested by historical data represent the true population structure,” Dick said. “Obviously, if you’re implementing protective measures in an area based on something less than a full awareness of the population structure of a group, you’re missing a key component when making decisions.”
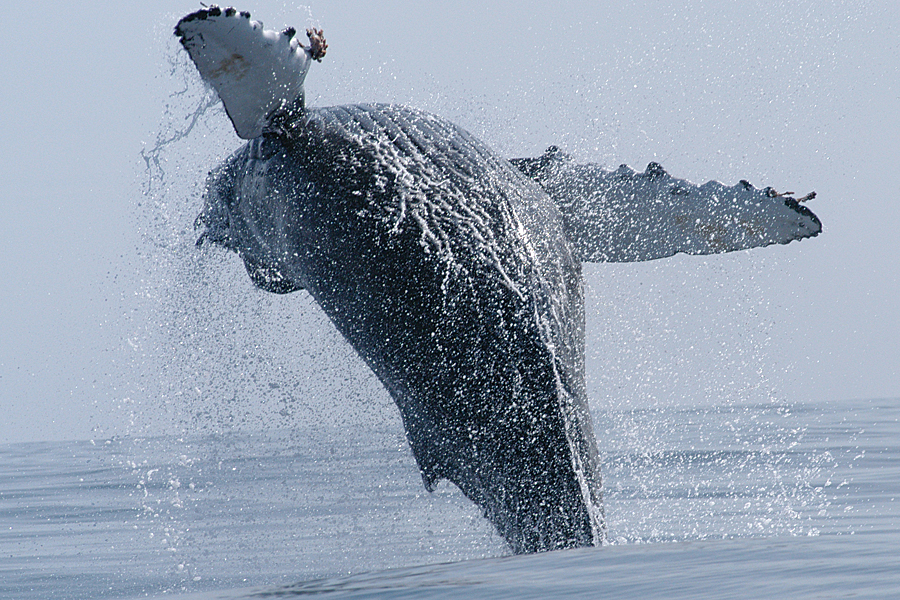
Biology and GIS
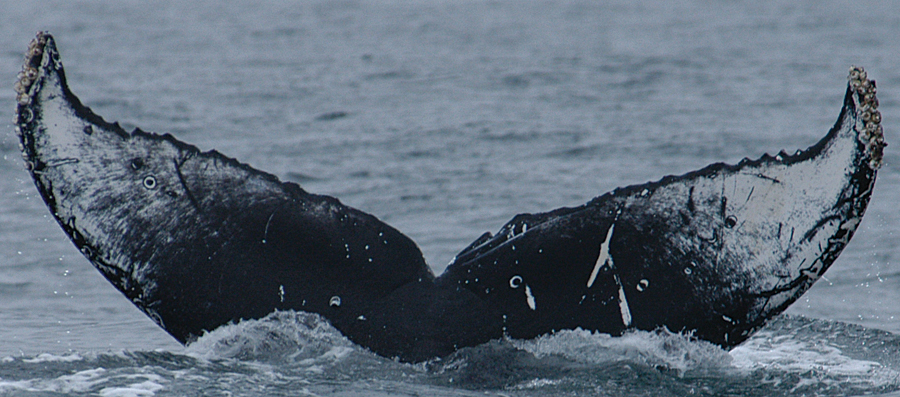
That lack of actionable data led to what Dick describes as a “natural collaboration” between the fields of biology and GIS. SPLASH researchers working on the water used handheld GPS units to record the coordinates of humpback sighting locations. Photographs were taken of the undersides of humpbacks’ flukes (or tails). Each humpback fluke bears a pattern that is as unique as a human fingerprint. Tissue samples needed for genetic analysis were collected using retrievable darts fired from small crossbows into whale backsides. The resultant SPLASH database included 19,000 fluke images and 6,000 tissue samples. ArcGIS and geneGIS were used to merge and study these records.
“We can now map where we see individuals in the ocean, the genetics of that population, and how the genetic structure is spread out across a spatial extent,” Dick said. “With the coordinates of where whales have actually been found, we don’t need to use a priori information researchers have used in the past. By bringing that data into ArcGIS and mapping it, we can then ask the right questions about population structure and genetic diversity.”
Dick expects ArcGIS to become an increasingly important component of marine research and ocean-habitat management. Looking ahead to future efforts, she hopes to develop geneGIS tools that will use geolocation data for confirmed sightings of an individual whale to determine the most likely path it has traveled. She also plans to open a new area of research by using ArcGIS to create “finely tuned spatial structuring” in forage waters off Alaska in an effort to study the potential effects of the seascape itself on humpbacks’ genetic diversity.
“If we really want to make a difference in the way in which oceans are managed that spatial element has to be incorporated into decision making,” Dick said.
Given geneGIS’s utility to any researcher working with a combination of genetic data and geolocation information, Dick expects the tool she’s created to find applications beyond ocean-based research, in projects involving freshwater fish—such as salmon—or even terrestrial species.
“Any researcher with spatially referenced data can use these tools to gain new perspectives on how animals move about and use their environments,” she said. “GeneGIS allowed me to look in a new way at a marine species that’s been studied for years. Bringing that tool to other scientists so they can examine data in new ways … it gives you goose bumps.”
About the author