These two step-by-step tutorials will show you how to compare consumer spending for three locations using two ArcGIS location analysis tools: Esri Community Analyst and ArcGIS Online.
Esri Community Analyst is a software-as-a-service (SaaS) mapping solution hosted by Esri that includes both GIS capabilities and access to thousands of constantly updated demographic, health, economic, education, and business data variables. (Read about how a tax agency in Kansas is using Community Analyst to verify its retail valuations in another article in this issue, “Verifying Valuation Rates Using Location Analytics: Data Enrichment for Better Retail Property Appraisals.”)
ArcGIS Online is a collaborative, cloud-based platform that allows members of an organization to use, create, and share maps, scenes, apps, and data and access authoritative basemaps, geospatial analysis tools, and ready-to-use apps.
Both exercises walk you through the process of generating a table that shows the estimated dollar amount that consumers located within a five-minute drive time of each of the three locations will spend on retail goods for the current year. The table will be saved to a file so that it can be used outside ArcGIS.
Tutorial 1: Using Esri Community Analyst
If you have a subscription, sign in to Community Analyst. If you do not have one, you must first have an ArcGIS Online subscription. If you have an ArcGIS Online subscription, sign in and obtain a free trial of Esri Community Analyst. If you do not have an ArcGIS Online subscription, get a free trial.
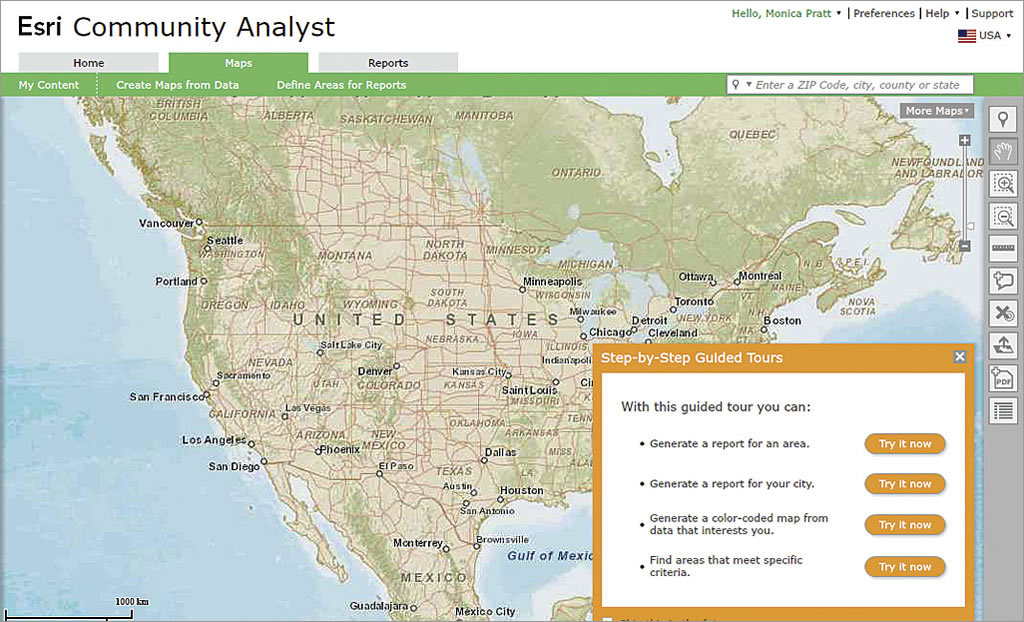
- Click the Maps tab at the top of the screen and click Define Areas for Reports from the bar below the tab. There are four options. Choose Find Location.
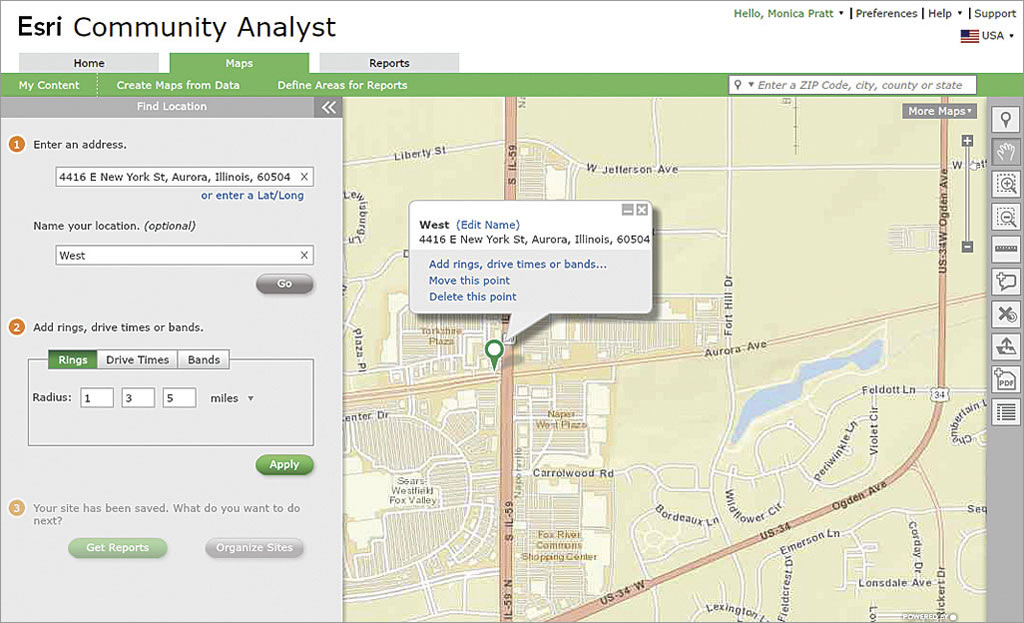
- On the Find Location pane, enter the address 4416 E New York St, Aurora, Illinois, 60504. Name the location West.Click Go.
- Repeat the previous steps to enter the address 2900 Highland Ave, Downers Grove, Illinois, 60515, with the name Yorktown and 1 Oakbrook Ctr, Oak Brook, Illinois, 60523, with the name Oakbrook.
- Add a five-minute drive time around all three locations at the same time by click the Drive Times button and deleting the 10 and 15 from the second and third boxes. Keep the 5 in the first box and click Apply. On the Apply drive times dialog box that appears, verify that all three locations are checked and then click Apply.
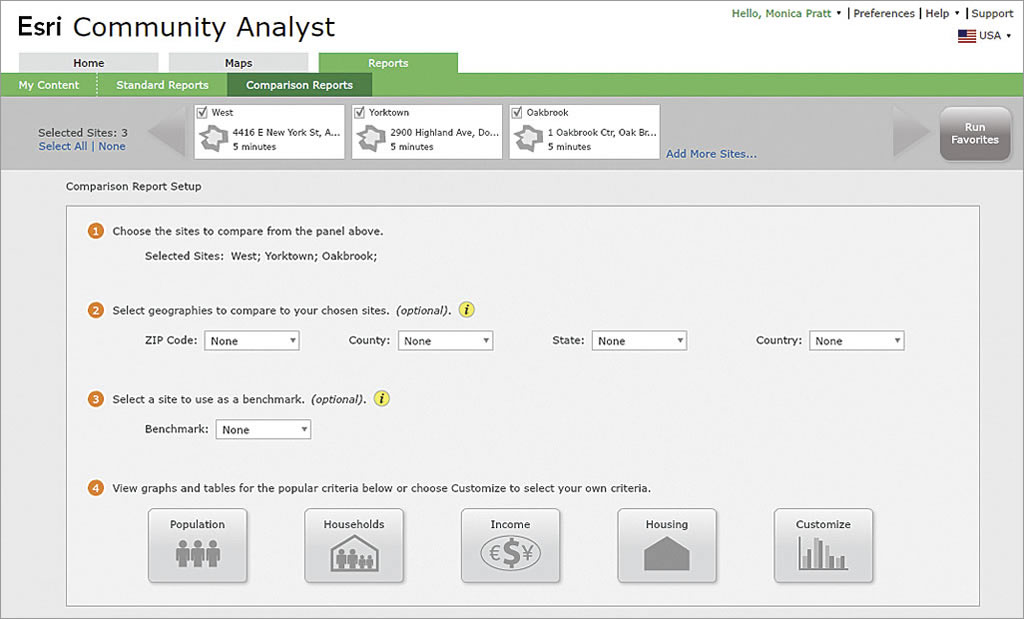
- Click the Get Reports button on the Find Location pane. On the Reports tab, click Comparison Reports. On the Comparison Report Setup step 1, make sure that the three sites you entered are listed. Only West, Yorktown, and Oakbrook should be checked.
- Leave defaults for steps 2 and 3 but click the Customize button under step 4. On the Customize tab, click the Get Started button.
- Explore some of the variable choices (e.g., Population, Health) by clicking the buttons on the Select Your Variables page. Clicking any button will take you to a second Select Your Variables page. When you are finished exploring, click the Categories icon to return to the original page.
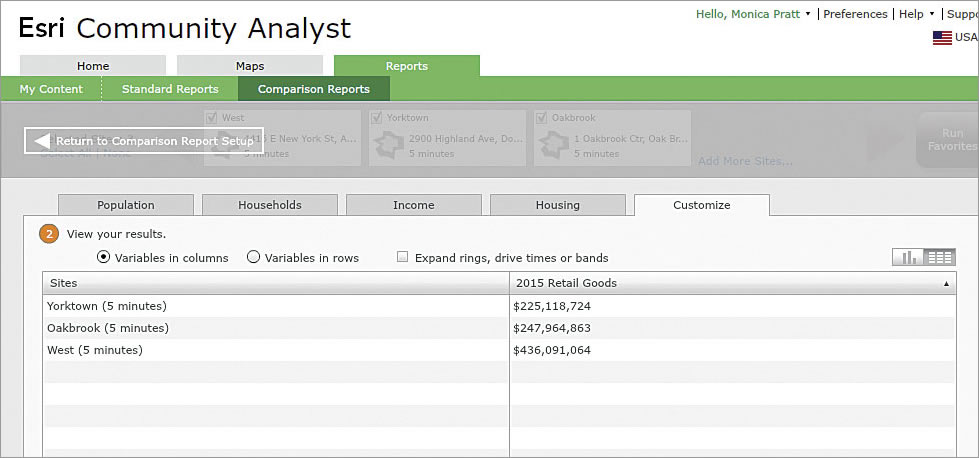
- In the Search for a variable name text box, type retail and click the Search icon. From the list that appears, choose 2015 (or current year) Total Expenditures and Retail Goods to expand it. Check the box next to 2015 Retail Goods.
- Click the View Table button in the lower-right corner of the screen. On the table that appears, click the 2015 (or current year) Retail Goods column header to sort the results in ascending order.
- Click Export to Excel and, when prompted, click OK to save the file to your computer.
Tutorial 2: Using ArcGIS Online
In this exercise, you will learn how to use the Enrich Layer tool in ArcGIS Online to rank commercial centers based on retail expenditures from the nearby population and generate a table showing annual estimates for retail goods spending in the five-minute drive time around three major commercial centers in Naperville, Illinois. You will save this table to a file so that it can be used outside ArcGIS Online.
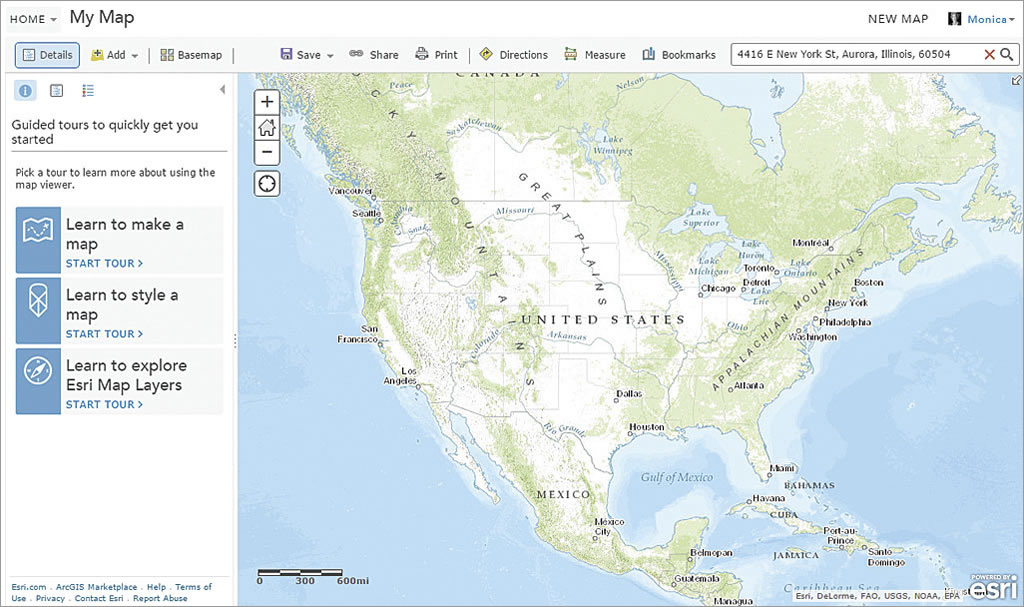
- Sign in to ArcGIS Online with a login that has either a publisher role or a custom role that has permissions to use the analysis tools in ArcGIS Online. Once signed in, click Map at the top of the page. On the Map Viewer page, click New Map at the top of the page to start a fresh map.
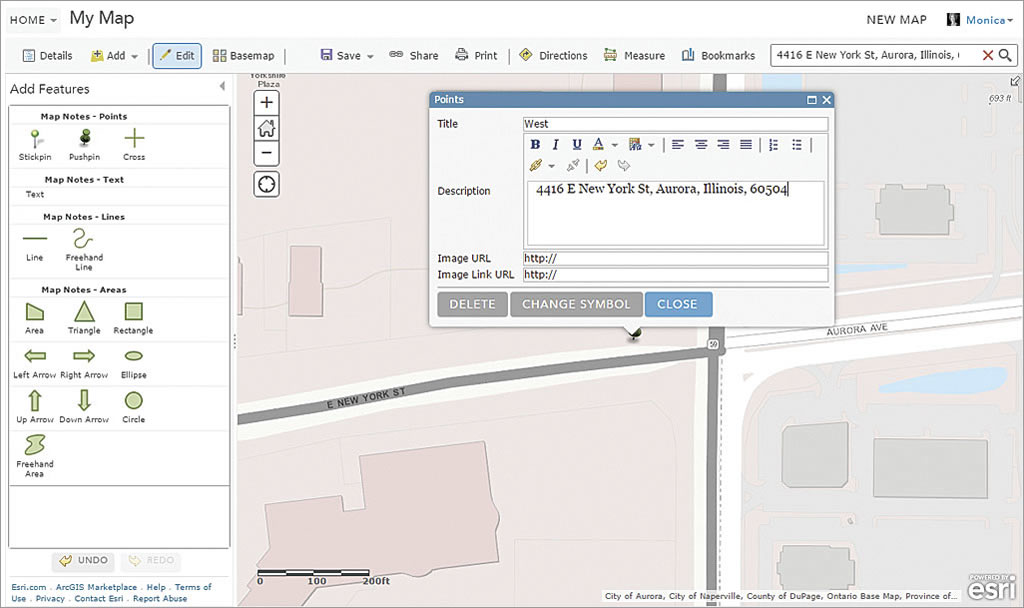
- Type 4416 E New York St, Aurora, Illinois, 60504, into the search box and click the search icon. Click the Add button and in the drop-down, choose Add Map Notes.
- Click the Create button to add a Map Notes layer to the map. Map Notes will be used to add point locations representing commercial districts. Click the pushpin icon on the Map Notes palette and then click E New York St to add the first location. Type West for the title, include 4416 E New York St, Aurora, Illinois, 60504, for Description, and close the pop-up.
- Locate 2900 Highland Ave, Downers Grove, Illinois, 60515, using the search box; add a Map Notes layer; add a pushpin icon near the address and Yorktown as the title and the address as the description; and close the pop-up.
- Use the same procedure to locate and add a pushpin to the Map Notes layer 1 Oakbrook Ctr, Oak Brook, Illinois, 60523. Use Oakbrook as the pop-up title.
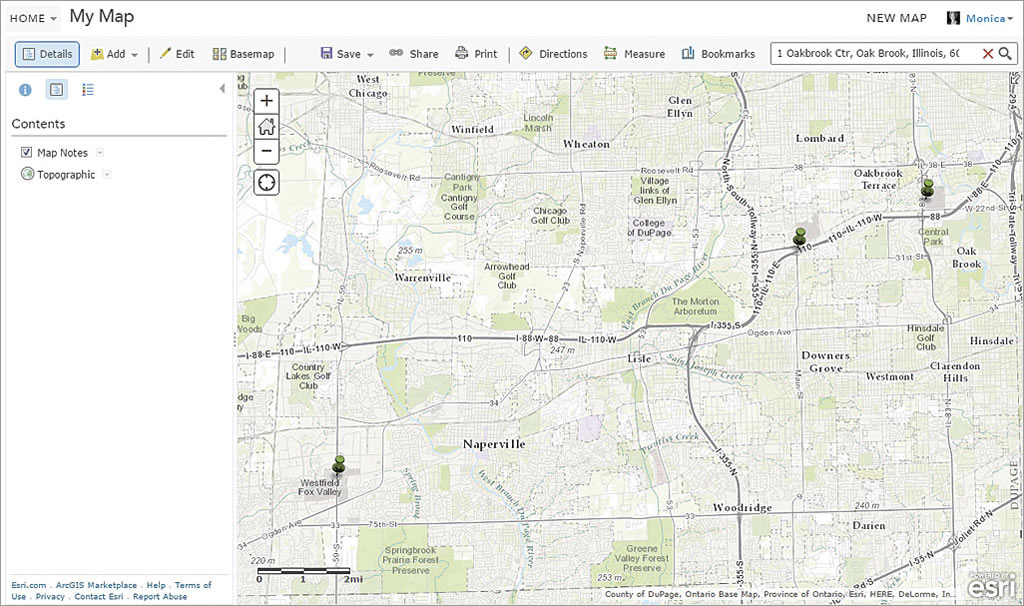
- At the top of the map, click the Details button, then the Content button, to see the layers in the map. Click the dropdown arrow next to Map Notes and choose Zoom to see all three locations.
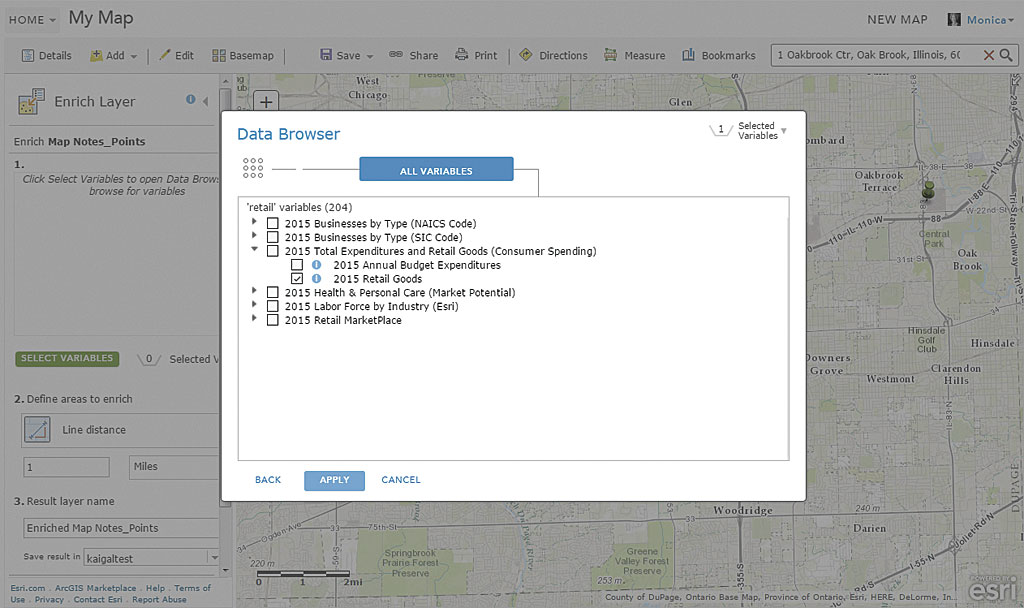
- Click the drop-down arrow next to Map Notes and choose Perform Analysis. In the Perform Analysis pane, click Data Enrichment, then Enrich Layer.
- Click Select Variables, type retail in the search box, and press Enter. Click the arrow next to 2015 (or current year) Total Expenditures and Retail Goods (Consumer Spending) to expand its list. Check the check box next to 2015 Retail Goods. Click the Apply Button.
- To define areas to enrich, choose Driving Time and type 5 in the text box next to Minutes. Name the result layer Enriched Locations. (If there is already a layer with this name in your organization, choose a different name.) Click Show credits to see how many credits this analysis will consume, then click the Run Analysis button.
- When the analysis is complete, uncheck Map Notes in the Contents. Click on one of the points and scroll down in the pop-up to see the Retail Goods field, which shows the estimated total of current year retail goods expenditures in the five-minute drive time around the point.
- Optionally open the table for the Enriched Locations layer by clicking the arrow next to the layer and clicking Show Table. Scroll to the right to see the Retail Goods field. It may be helpful to see the five-minute drive times around the locations. If you would like to add drive-time polygons to your map, click the arrow next to the Enriched Locations layer in the contents and choose Perform Analysis > Use Proximity > Create Drive-Time Areas. Follow the step-by-step instructions on the tool.
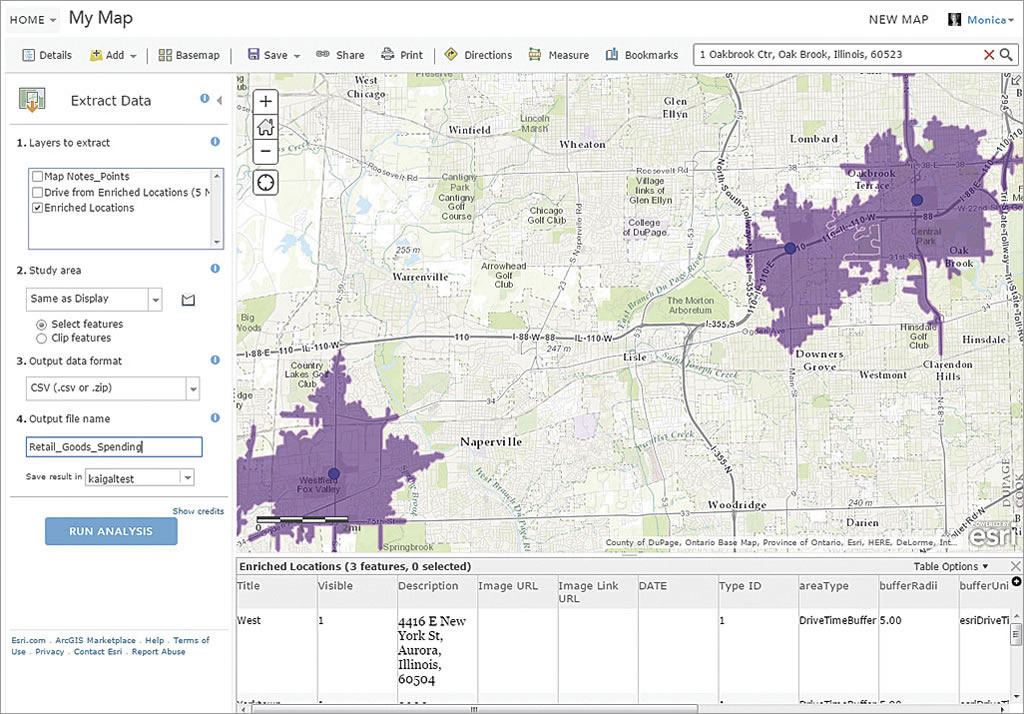
- To create an output table, first click the arrow next to the Enriched Locations layer, click Perform Analysis and then Manage Data, and click Extract Data. On the analysis pane, for layers to extract, verify that Enriched Locations is checked. Verify that all three locations are visible on the map. Use Same as Display for the study area and name the output Retail_Goods_Spending.
- Click Show credits to see how many credits will be used. Click Run Analysis. Click OK on the dialog box that tells you the data will be available in My Content.
- From the drop-down under Home in the upper left of the interface, choose My Content. If you have a lot of content, sort the list of contents by date modified by clicking Modified at the top of the list. If necessary, click again to get the newest items at the top. You should see an Extract Data layer with the current date. If it is not visible yet, wait several seconds and refresh the browser.
- To download the extracted comma-separated values (.csv) file, hover over the arrow next to the item name and click Download.