When Hurricane Florence made landfall in North Carolina on Friday, September 14, 2018, the City of New Bern was as ready as it could have been.
Located near the coast at the confluence of two rivers, New Bern was about 90 miles from the hurricane’s point of impact. The city had prepared for big storms before. Two years ago, when Hurricane Matthew—initially a category 5 storm—was forecasted to roll through the Carolinas, the city set up Esri’s Damage Assessment configuration of Collector for ArcGIS to help emergency responders keep tabs on field resources and conduct damage assessments. But Hurricane Matthew turned back into the Atlantic Ocean after making brief landfall as a category 1 storm in South Carolina, and New Bern was spared.
“We only had 10 houses that were damaged by trees,” said Alice Wilson, the city’s GIS manager. “We lucked out.”
As Hurricane Florence billowed and roared across the Atlantic in early September 2018, it became clear that New Bern wouldn’t be so lucky this time.
“When we heard that Florence was coming and we knew how bad it was going to be, our first thought was to evacuate,” said Wilson. “But then we knew some of us had to stay here to help the people who stay behind. […] We knew there would be significant impact and we’d have to go out into the field as soon as possible.”
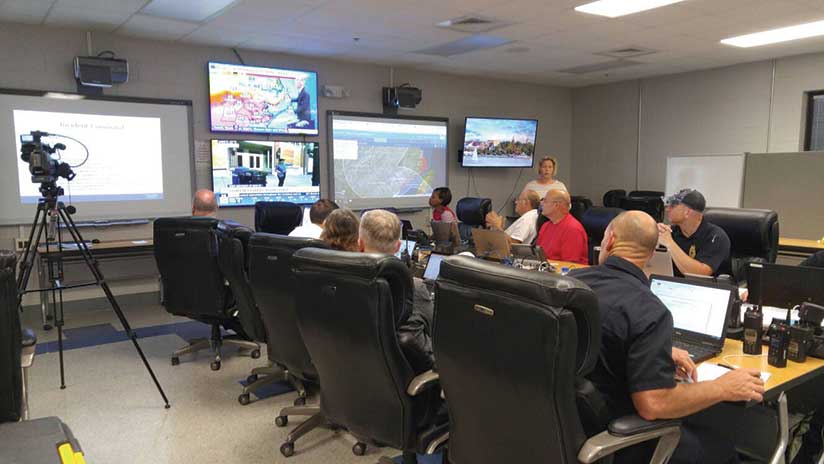
City officials set up an emergency operations center (EOC) the day before the storm hit. Wilson and her team tested all their geospatial tools ahead of time, including the Damage Assessment configuration that emergency responders would use out in the field and the dashboard that teams in the EOC would employ to oversee operations. They also wanted to be able to provide the Federal Emergency Management Agency (FEMA) with as much information as possible as quickly as possible.
“They had me, as the GIS manager, in a central position in the EOC,” said Wilson. “I had utilities on one side, public works on one side, and fire and police across from me.”
Initially, Wilson and her colleagues looked for areas they knew would incur the most damage so they could turn off utilities. This would also help them be ready to deploy fieldworkers to fix downed power lines and burst water and sewer pipes after the storm was over.
“We knew, based on our elevation data, [which] areas would be affected,” said Wilson.
City officials also knew from Hurricane Irene in 2011 that the Neuse and Trent Rivers that surround New Bern could swell up to seven feet, if not more. Wilson pulled stream gauge data into ArcGIS Desktop so staff in the EOC could monitor the rising rivers. They readied for water rescues.
“We’d put a mandatory evacuation in place, but people stayed for one reason or another,” said Wilson.
When Florence hit on Friday afternoon, its impact was immediate. The rivers swelled by 10 feet.
“We were getting call after call for water rescues,” she said. “People were calling, telling us they were in their attics and needed to be rescued.”
By 11:30 p.m. that night, staff at the EOC were aware that about 150 people needed to be rescued, according to the City of New Bern’s Twitter account. But that was only half of what was to come.
“We got through our stuff and then got a call Sunday morning at 1:00 that [the neighboring town of] Pollocksville needed water rescues,” said Wilson.
Rescue teams from New Bern weren’t familiar with Pollocksville. At one point, the fireman in the EOC said his water rescue crew couldn’t find high ground, so Wilson used GIS data from North Carolina’s statewide GIS advisory group and found contour lines for Pollocksville. She then employed ArcGIS Desktop to map where that crew was and where it needed to go to get to higher ground.
“We conducted over 300 water evacuations,” said Wilson, “and not even just in our city.”
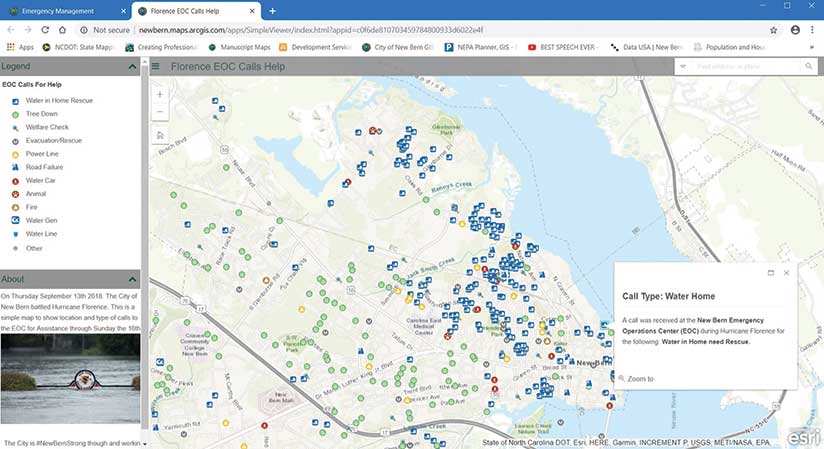
Using data from ArcGIS Living Atlas of the World and local information, such as where street closures and shelters were located, Wilson and her team created online, public-facing maps as well. They posted a tabbed story map on the city’s website that showed stream gauges, wind velocity, and more information about Florence’s sheer potency. They also have a live app that displays all the power outages in New Bern in real time, which proved crucial during the storm, saving city staff an untold amount of time answering phone calls from residents asking about outages.
The whole time, Wilson manned two computers: one that showed a map of New Bern in ArcGIS Desktop and one that pulled the online maps and apps she and her team had built into a dashboard that everyone in the EOC could see on a big monitor.
“It was pretty chaotic, but we tried to make sure we had as much information as possible as Florence came in,” said Wilson.
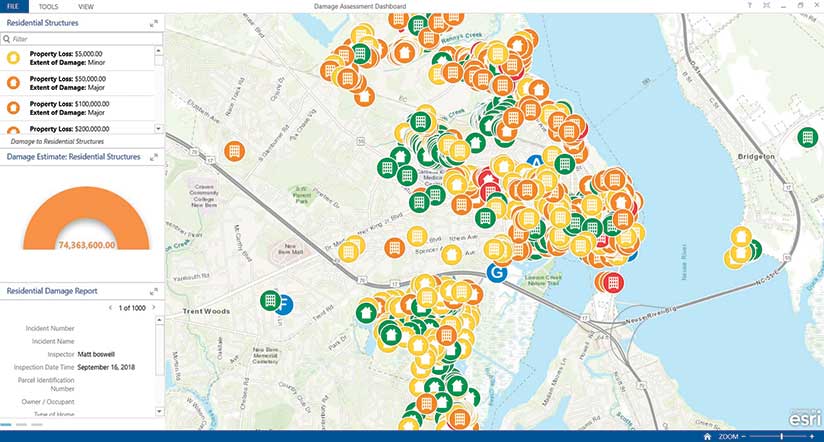
The storm passed through on Sunday, September 16, and the City of New Bern immediately began doing damage assessments using the Damage Assessment configuration it had set up in Collector. Utility workers, firefighters, and inspectors—from both New Bern and outside cities—jumped in to help.
Some of them had never used Collector before, let alone the Damage Assessment configuration, so Wilson and her colleagues got them trained quickly and sent them into the field. There were seven teams in all. Utility workers went first to the houses they knew had been completely inundated by water to see what they would need to do to restore service. Firefighters and inspectors went out in pairs to examine any fire concerns and record all the destruction using the app.
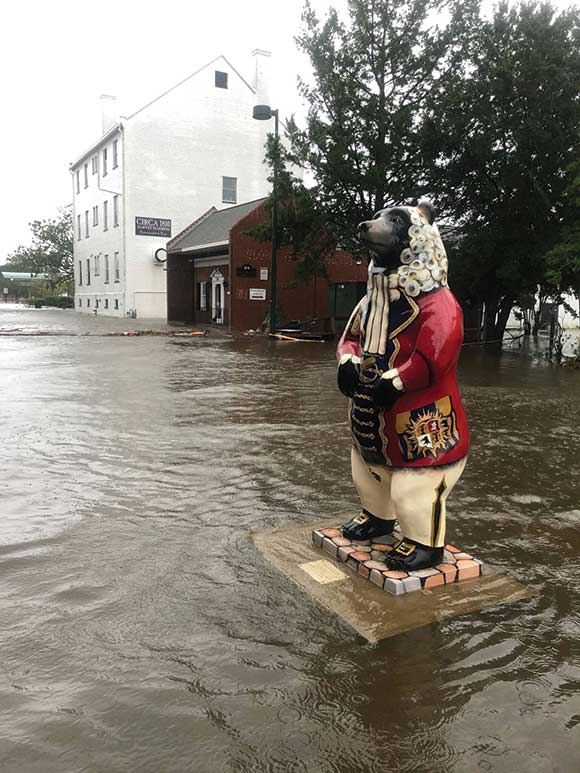
“We had significant damage,” said Wilson. “The storm surge affected us the most.”
In addition to the 10-foot floods that deluged some parts of town, New Bern had four feet of water inside its historic downtown buildings. Big bear statues that usually stand outside certain businesses were floating down the street. And a few yachts ended up land bound, stranded next to houses and a hotel.
By the following Friday—just seven days after Hurricane Florence hit—New Bern had finished its damage assessments.
“All the houses that were really damaged fell right where we thought they would,” said Wilson. “So we knew our data was good.”
Inspectors recorded an estimated $100 million of losses to both commercial and residential properties. Although that number is breathtaking—especially for a city of 30,000 residents—Wilson was impressed by how fast New Bern recorded this much damage.
“I was here when we had Hurricane Irene, [which] was probably the worst hurricane that I’ve been a part of,” said Wilson. “Back then, inspectors would use these forms that were FEMA-generated, and they would go handwrite all this information. They would bring it back to me, and I would have to enter it all. It was so time-consuming. You were trying to read somebody’s handwriting, and after a while, they would just scribble something because they were so tired.”
The Damage Assessment configuration, which works on both Collector and Survey123 for ArcGIS, is so much faster, according to Wilson.
“Because it’s spatially located, I don’t have to do anything,” she said. “We were sharing this live. We [didn’t] have to process it and turn it around.”
As of September 21, just a week after Hurricane Florence made landfall, FEMA was already aware of New Bern’s damage assessment values.
“Hopefully now we can plan a little better when we rebuild.”
“I can’t even think of the amount of time we’ve saved,” said Wilson. “Esri tools…have been instrumental in getting us back on our feet.”
With only a few injuries and no deaths recorded in New Bern due to Hurricane Florence, Wilson said she has never been prouder of her community.
“Without question, we just knocked it out of the ballpark and not only helped this city but also helped neighboring cities that didn’t have what we have,” said Wilson.