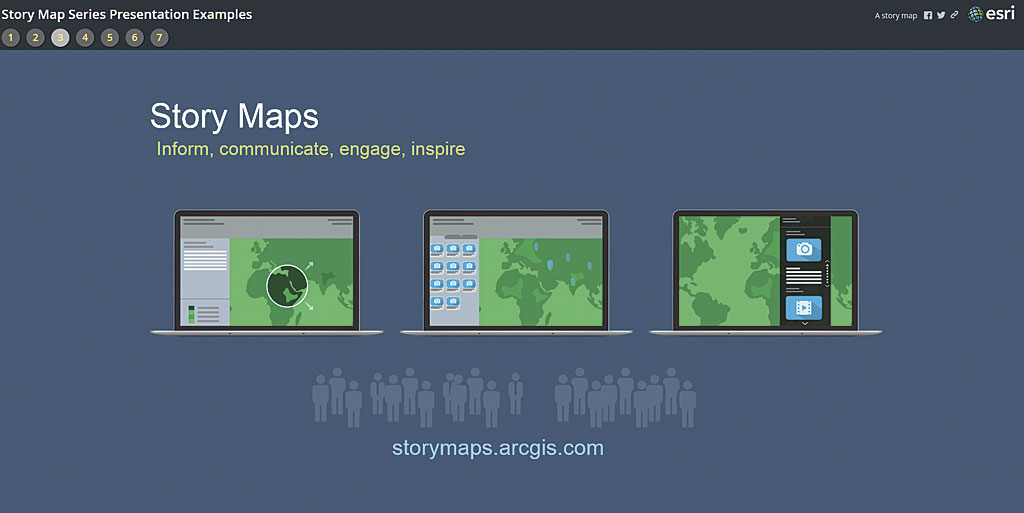
While Microsoft PowerPoint is the standard when it comes to presentations, using an Esri Story Maps app can offer a better option.
If you have to switch back and forth between PowerPoint and live demos, media, or websites, the process can be inconvenient and clumsy and the effect on your audience visually jarring and disruptive. While any story map can be used to deliver a presentation, some are better suited to the task than others.
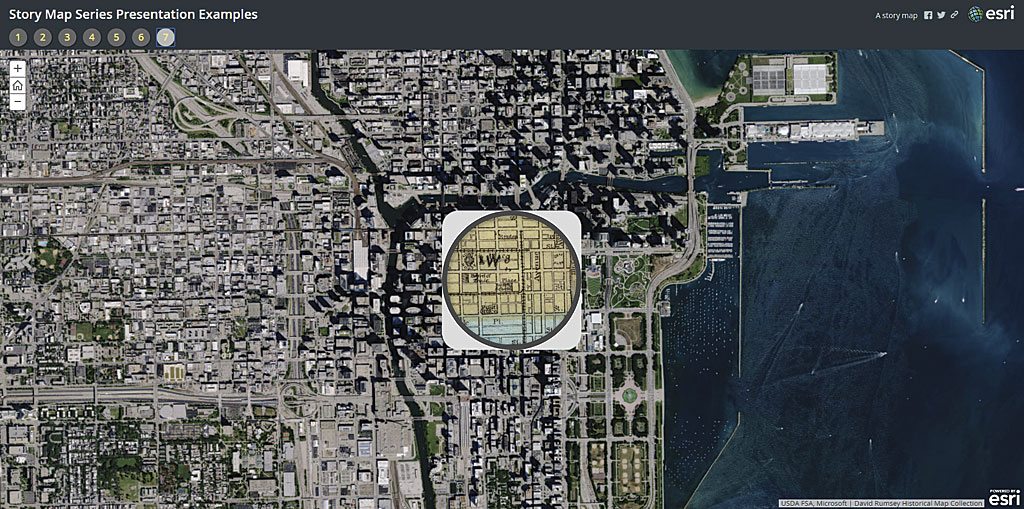
My preference is the Esri Story Map Series, specifically the Bulleted or Tabbed layout, since those provide sequential access moving from left to right and do not require a side panel for additional text or media—something not needed for most presentations.
Here are some tips on using a Story Map Series app instead of PowerPoint for your presentations. In this example, the Bulleted layout is used, but the Tabbed layout works in a similar way.
Adding PowerPoint Slides
PowerPoint slides can be added to your story map by exporting or capturing them as images, hosting them on your website or in your ArcGIS account, and adding them via a URL. You can also use Flickr, Google Photos, Facebook, Box, or Google Docs to host images. Ensure your images are sized appropriately for web use.
Add the image of the slide as an Image with the URL as the source.
Once you have the image of the slide saved and hosted, open the Story Map builder and add a page (which will add a bullet to the interface). In the Add Bullet dialog, click Image, then click URL as the source of the image and add the URL of the slide image.
Use Fit as the position for the slide—rather than the default option of Fill—so it won’t be cropped. This provides the best results for slides with text. The entire slide will be displayed ensuring no text will be cropped. Fit also ensures slides will display well on any projection resolution or with any aspect ratio. The text panel can be left blank. You won’t need it since your slides will include all the necessary text.
In rare cases, you may know the exact display resolution for your presentation. If you do, another option is to determine the size needed to fill the main stage, add a few pixels on all sides to ensure the slide completely fills the space, then use a position of Center. This technique only works when you build a presentation for a specific event and know the exact display size, since using Center (rather than Fit) to position your slides can crop your slides at different resolutions.
Changing the Slide Background
The main stage of a Story Map Series has a background color. When using the Fit option, the main stage background may be visible around the edges of the slide. To change the background, click Settings and choose the Theme tab. Choose a theme that will complement your slide background and click Apply when finished. Save your story map.
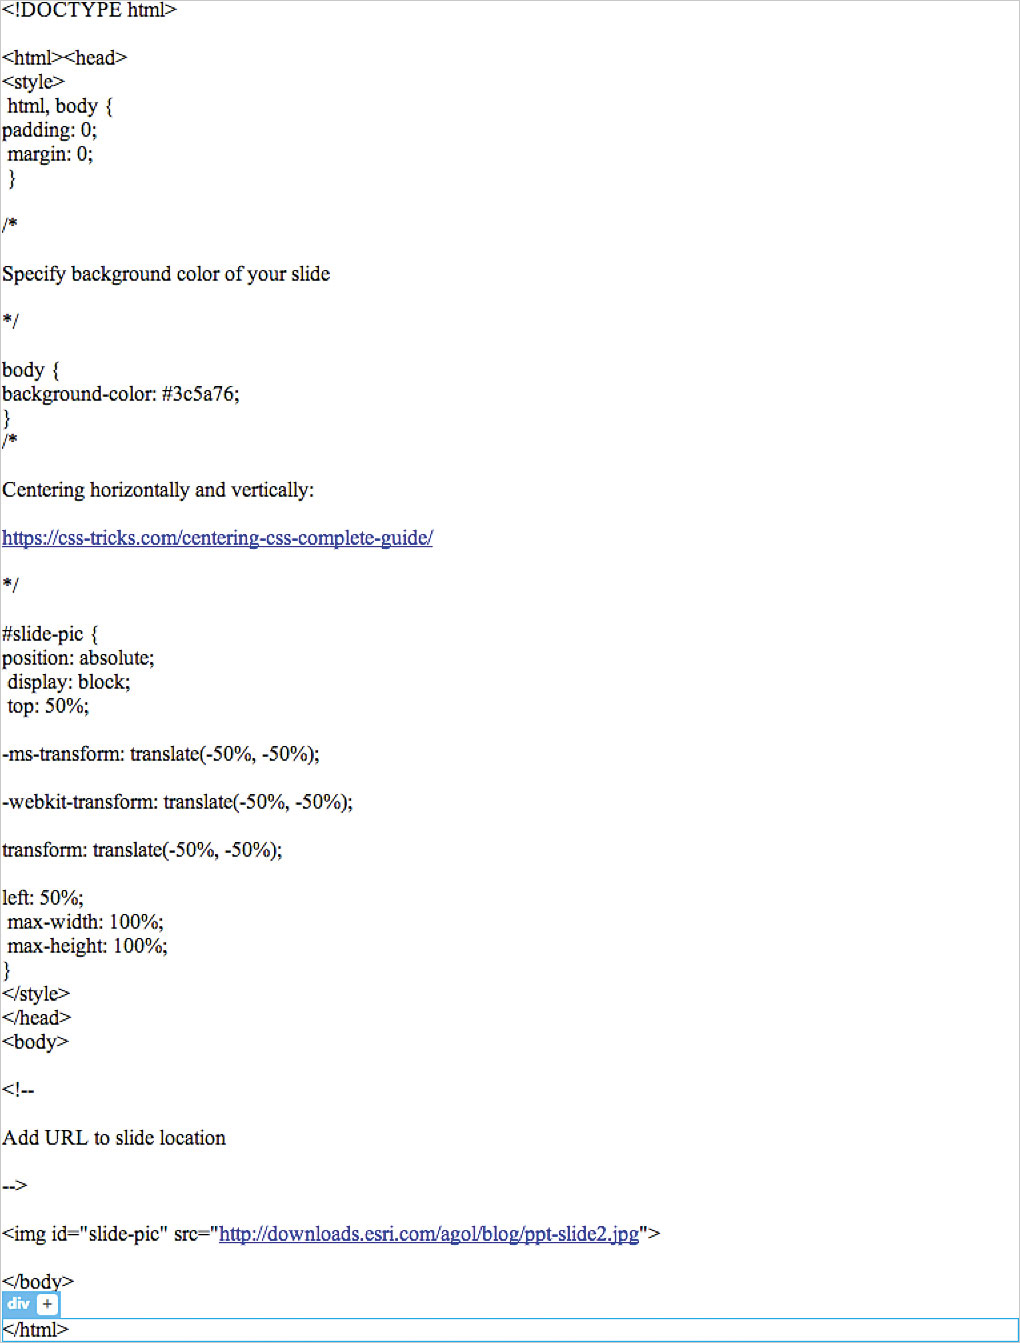
To eliminate the background, you can use a single color slide background and display the slide in a web page that has the background color set to match the page. Copy and paste the markup shown in Listing 1 into a new HTML document and make the necessary edits for the background color and slide URL as noted in the comments. Host the HTML document, and add it to your story map as a web page, using the default Fill option. The HTML will display the slide responsively so that it fits any size or aspect ratio.
Adding Maps, Apps, and More
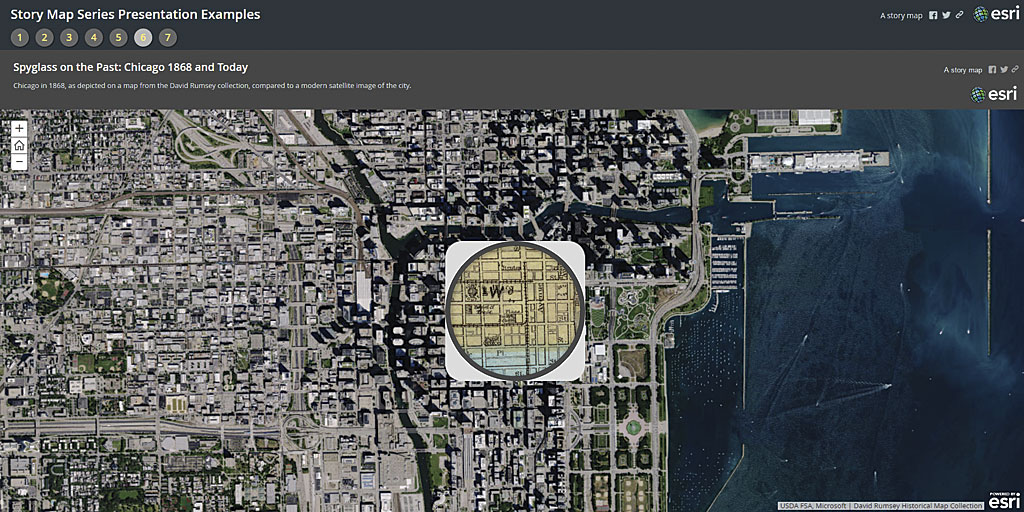
In addition to your slides, you will want to add web maps, apps, and other features. Add them using their URL and use the default Fill position. Since the map viewer and most apps and app templates are responsive, they’ll fill the entire main stage area. When embedding apps or other story maps, some offer options to minimize the user interface. This is recommended for best results. Once again, the text panel is not necessary and may be left blank.
Maximizing Your Presentation
When displaying your story map presentation in a browser, maximize the display area by appending &embed to the end of your story map URL. This eliminates the title (and subtitle if you have one) and only displays the bullets or tabs. You can also hide all browser bookmarks to gain additional space and display the presentation in full screen mode in the browser to omit browser tabs and use all available space. [For more information on embedding story maps, see the ArcWatch article “Learn to Embed a Story Map within a Story Map.”]
Tips and Considerations
Story maps are a powerful way to tell a story using maps and media. They can also be a powerful way to deliver presentations, but to get the best results, some thought and planning are needed. Here are a few more things to consider when using story maps for presentations.
It’s easy to author a terrible PowerPoint presentation. We’ve all suffered through our share of them. Crafting a great story map is somewhat of an art, and so is creating a great story map presentation.
Omit or limit the text in the story map so that the audience will listen to you, instead of reading words during your presentation.
Story map presentations work best when they are short. The Story Map Series app supports a maximum of 30 tabs or bullets.
Story maps do not offer the slide transitions and animations that are available in PowerPoint. If you feel these are necessary, stick with PowerPoint.
Choose the best story map for your purpose. The Story Map Series app, with its optional text panel, is ideal if you want your audience to focus on your slides and live apps.
When adding content via a URL that takes a while to initialize (such as a link to a detailed web scene), ensure that the Unload when reader navigates away option is unchecked. Before your presentation, you can warm up all your maps and apps so they will be preloaded. Unchecking this option ensures they do not need to be reloaded when you reach that portion of your presentation.
See the story map created for this tutorial.
For more information, read Bern Szukalski’s posts on the ArcGIS Blog.