The Northern Virginia Solar Map was successfully completed and unveiled in August 2016. GIS technology and Esri’s ArcGIS software proved indispensable in the development of the web app, which lets property owners evaluate the benefits and impacts of placing photovoltaic (PV) panels on their roofs.
“With existing GIS technology, can the solar energy potential of northern Virginia building roofs be determined and provided to the public as an online service?” Robert Lazaro, director of Regional Energy and Sustainability Policy at Northern Virginia Regional Commission (NVRC) had asked. At the time, it was not clear if such a project could be undertaken. NVRC began thinking about creating an online solar map that would provide information on the potential of this alternative energy source.
NVRC is a regional council of 14-member local governments in the Northern Virginia suburbs of Washington, DC. It is composed of Alexandria, Arlington, Fairfax, Loudoun, Prince William, Falls Church, Herndon, Leesburg, Manassas, Purcellville, Dumfries, and Vienna local government jurisdictions.
Scoping the Project
To determine how it would go about creating a solar map web app, NVRC studied the processes recommended by the National Renewable Energy Laboratory (NREL) for calculating solar energy potential. NVRC also consulted publications on this subject and contacted energy experts and people who had experience with solar mapping—even local solar panel installers.
Brandon Flessner, a GIS analyst with the Ohio-Kentucky-Indiana Council of Government (OKI), readily shared his experience in developing the web map OKI Solar Ready II, using a grant from the US Department of Energy. NVRC decided to adopt Flessner’s method in the development of its own solar map, which would be the first of its kind in the Commonwealth of Virginia.

Elevation data was required to produce the solar radiation, slope, and aspect rasters needed to calculate solar energy potential. Areas occupied by buildings would be extracted from these rasters by using building polygon data in a clipping operation.
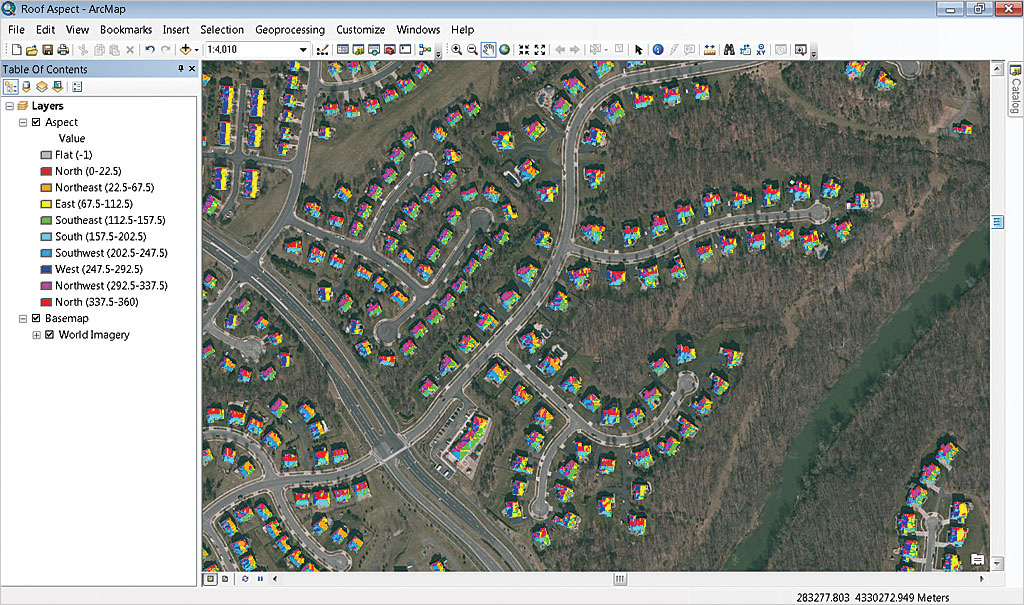
The slope raster was used to eliminate roofs with a slope of more than 50 degrees from the solar raster, as these roofs would be unsuitable for solar panels. The aspect raster was also used to filter out north-, northeast-, and northwest-facing roofs from the solar raster, as those roofs would be unsuitable for solar panels. The last step was to determine the size of the portion of each roof that was suitable for solar panels and aggregate the energy potential for each roof.
Obtaining Data and Choosing Software
Once the kind of information product that would be supplied by the web app was determined and the methodology for providing it was identified, the next challenge was deciding where to obtain the data and what software would be required.
Jurisdiction boundary and building polygon data would be needed. Fortunately, NVRC maintained geographic data in digital format for all local jurisdictions. However, because not all the data was current, some data had to be recollected. Lidar point cloud data records the elevation of surfaces very accurately, so lidar was chosen as the source for elevation data. However, the jurisdictions lacked lidar data.
The US Geological Survey (USGS) had lidar data as part of its multistate data collection effort. Initially NVRC had lidar data only for Loudoun County and a small part of Fairfax County. However, the project could start with the available data while it waited for the rest of the data.
USGS lidar data was either downloaded from the USGS Earth Explorer site or collected on disk from the USGS headquarters in Reston, Virginia. NVRC had license agreements for four seats of ArcGIS for Desktop and several licenses for the ArcGIS Spatial Analyst and 3D Analyst extensions as well as an ArcGIS Online for organizations subscription. ArcGIS Online could be used to create and publish the web application online, but the application—analyzing data for an area of 1,338 square miles that included 534,000 building polygons and 47 GB image data—would occupy a lot of space on ArcGIS Online. NVRC did not have sufficient ArcGIS Online credits to keep the application running all year.
The alternative was to use ArcGIS for Server software to host the site on NVRC’s own server. The Washington Metropolitan Consortium of Governments (WMCOG) agreed to provide a grant to NVRC to acquire ArcGIS for Server, overcoming a significant hurdle.
Lidar data was furnished in raw LAS file format that was in two coordinate systems: State Plane and Universal Transverse Mercator (UTM). NVRC decided all data would be processed in UTM, so lidar data in State Plane had to be converted to UTM. All Northern Virginia local government boundary and building data, also in State Plane, was also converted into UTM coordinates.
Generating Solar Radiation Rasters
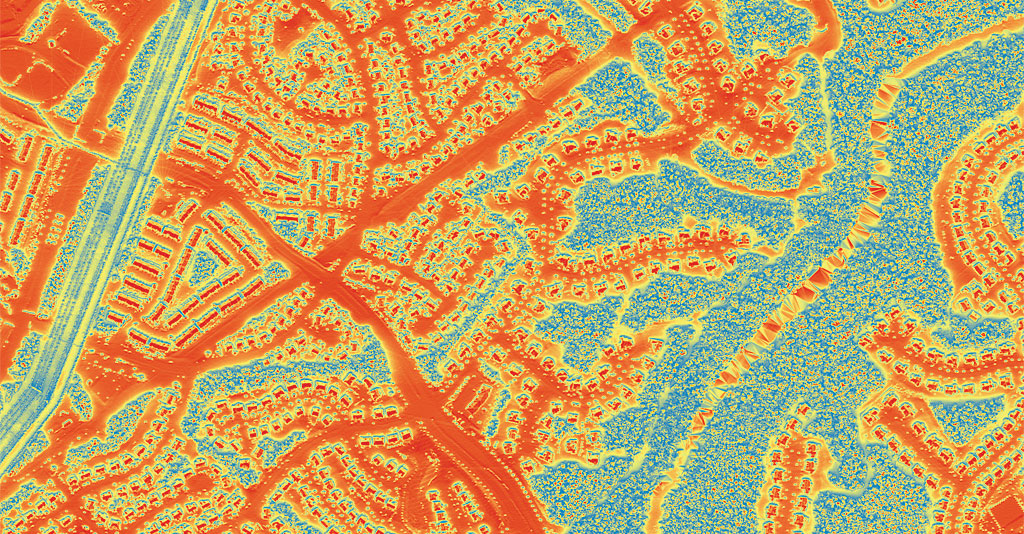
Generating solar rasters was a multistep process. First, a 1-meter resolution digital surface model (DSM) was created from first-return lidar points for each jurisdication. Using this DSM as input for the Area Solar Radiation tool available with the ArcGIS Spatial Analyst extension, a solar radiation raster for each jurisdiction was created. These rasters essentially identify areas that get a lot of sun and areas that do not.
The Area Solar Radiation tool employs an elaborate algorithm that calculates potential solar energy on a given surface by taking into consideration daily and annual variations of sun exposure and obstructions that would affect the amount of sunlight a surface receives.
The DSM for each jurisdiction was divided into approximately 30 tiles. It took between 18 and 20 hours (on average) to complete the calculation of solar insolation for an individual tile using a computer with 16 GB of RAM and a 2.93 GHz processor. The ModelBuilder application in ArcMap was used to loop through each tile and apply the Area Solar Radiation tool. Once all tiles were processed, they were reassembled into jurisdiction-wide solar radiation rasters.

Processing this data for 14 jurisdictions that ranged in size from small to large was the most expensive and time-consuming part. It would have taken approximately a year. Access to a facility with substantial computing power was needed to shorten this time. Fortunately, professor Matt Rice of the department of geography and geoinformation systems at George Mason University in Fairfax, Virginia, volunteered the use of a university computer laboratory during the 2015 Christmas break. The facility was otherwise idle, and this allowed NVRC to process the data quickly. The solar raster was generated in a matter of days. The collaboration with George Mason University helped NVRC achieve a critical project milestone.
Jurisdiction-wide slope rasters (slope in degree) and aspect rasters (surface orientation) were next generated for all jurisdictions. Once solar radiation, slope, aspect rasters, boundary layers, and building polygons were processed, solar energy potential could be estimated.
Estimating Solar Energy Potential
To estimate solar potential for each roof, the solar, slope, and aspect rasters were clipped using building polygons to obtain only the building footprint portions of each raster. Slope and aspect rasters were reclassified by entering 1 (suitable) or 0 (unsuitable) values for each cell. Eventually these reclassified rasters were multiplied by the solar raster in the Raster Calculator in ArcMap. This process eliminated all unsuitable roofs or roof planes, leaving only suitable roofs.
The Zonal Statistics as Table tool, also available with the ArcGIS Spatial Analyst extension, was used on suitable roof rasters. The energy potential for each roof was aggregated, but further refinement was needed because not all available energy could be harnessed. Suitable roof size was calculated from total roof size. The system size in kilowatts (kW) was determined based on suitable roof size and the average solar panel size in the area. In the final step, projected annual cost savings were calculated based on average energy costs per watt (which are 11 cents per watt in Northern Virginia) and suitable roof size. The building table was populated with this information. This process was repeated for each jurisdiction separately.
All 14 jurisdiction-wide solar rasters were reassembled into one area-wide (Northern Virginia) solar raster as a mosaic dataset, which was converted to a TIFF format file. All jurisdiction-wide building polygons, populated with solar energy attributes, were merged into a building layer for northern Virginia.
Creating the Web App
The app required an area boundary layer, a building polygons layer, and a solar raster. Two map services were created: one for the solar raster and the other for the building polygons.
The Northern Virginia Solar Map was created using ArcGIS Online. The Esri-provided Imagery with Labels basemap provided a geographic context for the app. The boundary layer for northern Virginia was added from the file, then the solar raster (as an image map service) and the building polygons (as a map service) created were added to the web map.
With the Northern Virginia Solar Map, property owners in northern Virginia can type in a valid address or pan and zoom in the app to locate their house and click on the building footprint, which displays a pop-up table showing the solar energy potential of their roof.
The project took about 18 months to complete. The Northern Virginia Solar Map will continue providing solar energy information on the buildings in northern Virginia for the foreseeable future, until updated lidar data is available or a new method for calculating solar energy potential is developed.
Commenting on the project, NVRC acting chairman Laurie DiRocco, who is also the mayor of the town of Vienna, said, “I am proud of NVRC’s efforts to help residents and businesses reduce their energy use and to promote solar in the region. This map is an effective tool in helping take the mystery out of going solar on your residence or commercial building.”
For more information, contact Shafi Bashar Khan.
About the author


