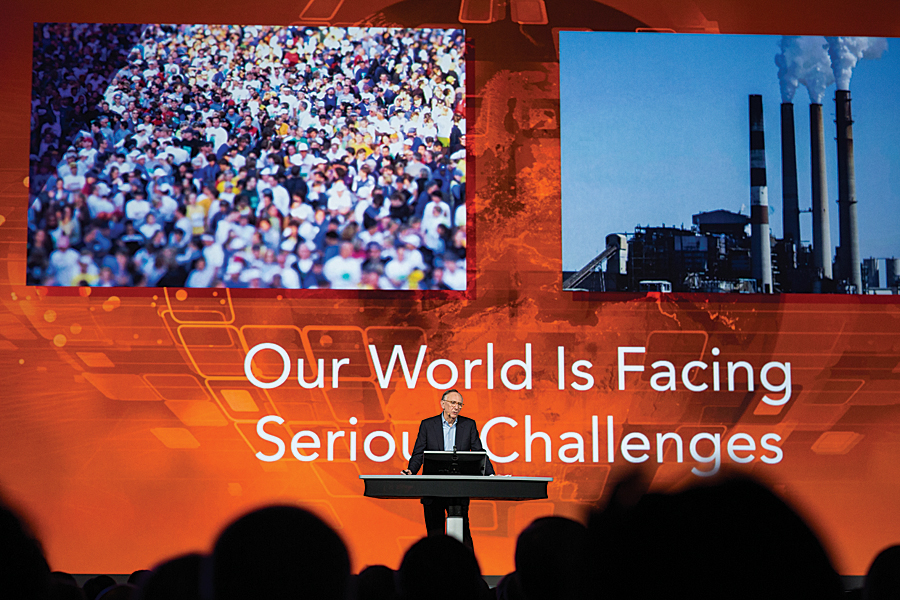
“GIS is integrating geography into virtually everything we do. GIS is changing the way we see things in our organizations and also at the planetary level. And it’s also changing how we act,” said Esri president Jack Dangermond, opening the 2014 Esri User Conference (Esri UC) and highlighting the event’s theme, GIS: Creating Our Future.
He noted that we are facing serious challenges—population growth, urbanization, pollution, natural resource depletion, and climate change—that impact on individual and societal levels because the world is both complex and interconnected. Geography is the science and GIS is the framework that can help us better understand the world and the effects our actions have on it.
GIS is integrating geographic knowledge into virtually everything we do. It’s changing the way we think by helping us to see and understand things differently, within our own organizations as well as at the planetary level. And it’s also changing how we act. As Richard Saul Wurman says, “Understanding precedes action.”
As part of the ongoing evolution of GIS, individual systems are becoming part of a larger interconnected platform that enables visualization, analysis, and better decision making. As we deal with severe climate events, drought, and other threats, the work done by GIS professionals to inform policy and improve disaster response is becoming more critical.
Showcasing the Many Roles of GIS
The increasingly pervasive nature of GIS is playing an important role in many areas: how businesses operate, how governments provide services, how transportation is managed, how disease outbreaks are handled, and how children are taught. All these roles played by GIS were illustrated by speakers who addressed the nearly 16,000 attendees to the conference held July 14–18 in San Diego, California.
Laurence Norton, director of business intelligence strategy and solutions at Starbucks, took the plenary stage to explain how Atlas, the company’s market planning and store development application powered by GIS, is helping Starbucks grow responsibly. Atlas lets Starbucks partners evaluate local trade areas, retail clusters, demographics, traffic, and transportation nodes to find the most promising sites for new locations. GIS not only helps Starbucks select new store locations, but by analyzing its customers’ spending habits, it can help tailor the placement of Starbucks products such as its upscale Clover brewing system and imminent wine and beer offerings.
A longtime GIS user, the City of Minneapolis is serving its customers—its citizens—better with GIS. The city made the benefits of its enterprise implementation available to more people with its ArcGIS Online website. The MapIT Minneapolis site helps citizens locate services, amenities, and information. Staff use it to work more effectively. According to Steve Misterek, the city’s GIS coordinator, “Answering the ‘where’ question for any project initiative or important decision is now easy for everyone!”
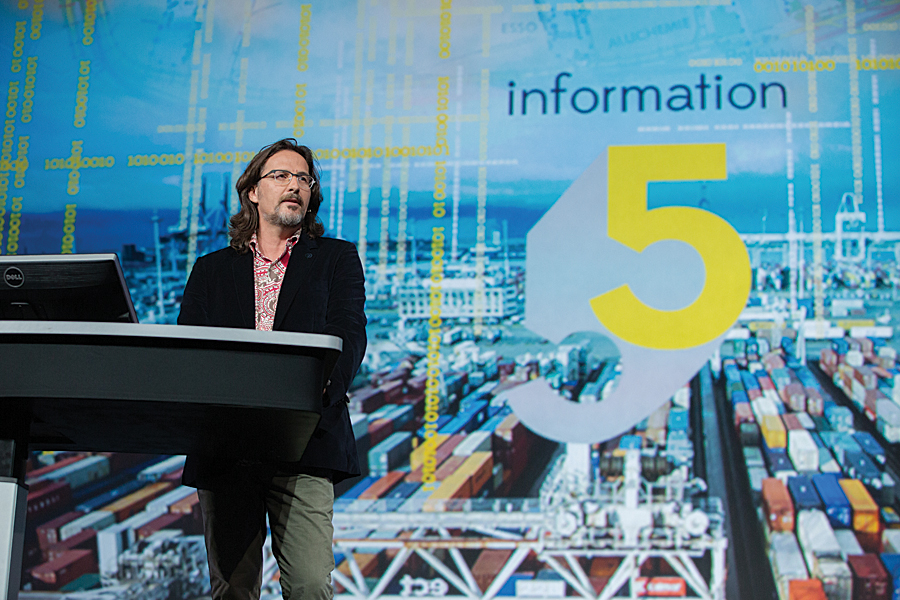
Through its simple-to-use GIS application, the complex operations and systems of the Port of Rotterdam in the Netherlands can be accessed from a single platform. Erwin Rademaker, project manager for PortMaps, described how the application has reduced redundancies and made the port more efficient. PortMaps includes SAP, SharePoint, and ArcGIS. “We used SAP for administrative and financial information,” said Rademaker. “We used SharePoint to store all our documents and technical drawings. And in the center, connecting everything with geographic information, there is ArcGIS.”
While PortMaps eliminates redundancies, Dr. Bruce Aylward, from the World Health Organization (WHO), and Dr. Vincent Seaman, from the Bill & Melinda Gates Foundation, are using GIS to eliminate polio. The conference’s keynote speakers demonstrated how mapping technology helps them locate children in developing countries who need to be vaccinated. “Over one billion children now in total have been vaccinated multiple times through this initiative,” said Aylward.
GIS is being used to foster the well-being of children in another way. As part of the ConnectEd initiative of US President Barack Obama, Esri has pledged $1 billion of software to the effort by making ArcGIS Online organizational accounts available for free to all K–12 schools in the United States.
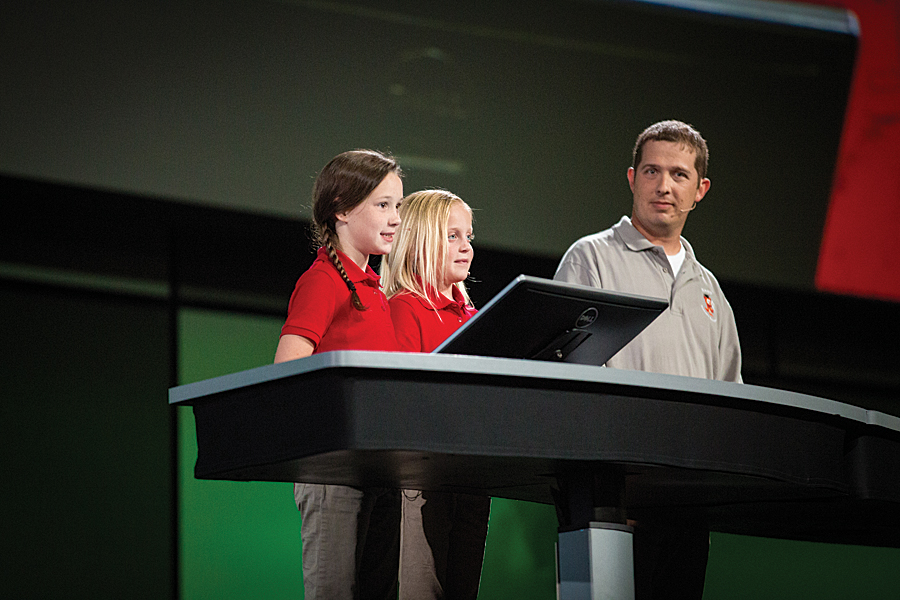
Two students from Sonora Elementary School in Springdale, Arkansas, demonstrated just what students, even very young ones, can do with these tools. Rikki Vaughan and Kylie Miller, two fourth graders, and their teacher, Josh Worthy, told how ArcGIS was being used by students to solve problems in their community and explore science. Vaughan demonstrated a project that mapped where veterans live in relation to Walmart stores as part of a campaign by a nonprofit to benefit those veterans. Miller told how she and fellow students tracked a weather balloon they launched. They animated the balloon’s travels in 3D. The girls received a standing ovation from the crowd as they cartwheeled off the stage.

Recognizing Great Work
The many achievements of GIS users are celebrated at Esri UC. During the Plenary Session, several organizations and individuals received special recognition. Royal Dutch Shell received the Enterprise GIS Award for its GIS integration, which benefits people throughout the company from experts to casual users. Making a Difference Awards went to Haru Hyashi, from the Research Center for Disaster Reduction Systems at Kyoto University, and Daniel Eriksson, head of information management at the Geneva International Centre for Humanitarian Demining. The City of Rancho Cucamonga, California, received the President’s Award for its use of GIS to promote sustainable growth. In a separate ceremony later in the week, more than 150 organizations, chosen from the more than 300,000 that use Esri software, received Special Achievement in GIS Awards.
Making Data Accessible
The importance of data was a recurring theme during the Plenary Session. US Secretary of Commerce Penny Pritzker underlined the importance of data including open data. “Data is a key pillar of our department’s open-for-business agenda,” Pritzker told the audience. “For the first time, we have made it a department-wide, strategic priority to unleash more of our data to strengthen our economic growth; to make our data easier to access, understand, and use; and to maximize the return for businesses, entrepreneurs, government, taxpayers, and communities.”
Esri supports open data with the ArcGIS Open Data application, which is included as part of ArcGIS Online subscriptions for organizations. With it, organizations can quickly set up a website that shares just the data the organization wants to make available.
Dr. Kathryn Sullivan, administrator for the National Oceanic and Atmospheric Administration (NOAA) and former astronaut, expanded on Pritzker’s open data message. NOAA is one of the agencies under the Department of Commerce. Sullivan said her agency strives to provide authoritative and timely data. Environmental intelligence coupled with GIS tools can “provide us [with] powerful situational awareness, insight, and perspective we could never gain otherwise.”
Hurricane Sandy, said Sullivan, drove home the point that communities and agencies need to do more than just respond and rebuild after a natural disaster. “It reminded us that what we need to focus on is not just being prepared but becoming resilient,” Sullivan said. “As we factor into our rebuilding decisions, we need to not think just about building back to what we were before a storm. We need to think about building for what’s coming ahead.”