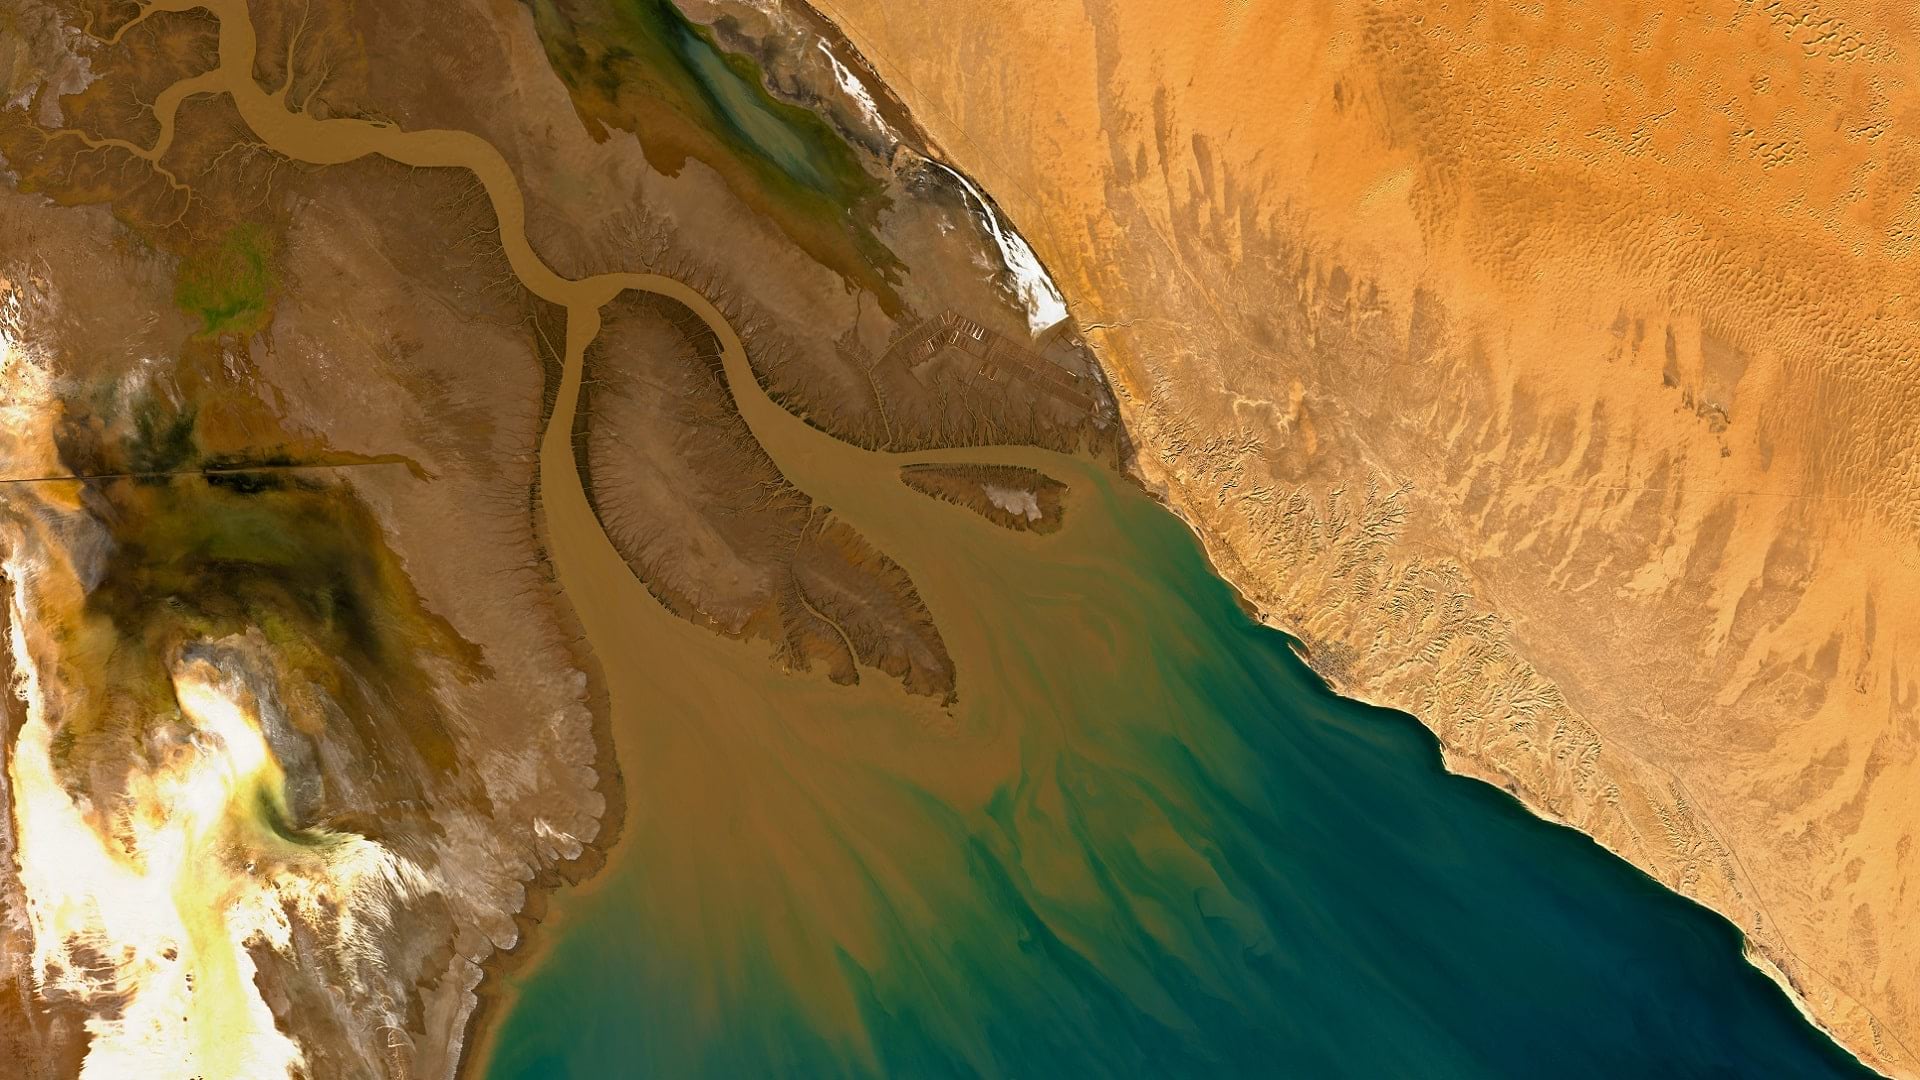
Once comprising more than 1.5 million acres of habitat that teemed with plant and animal life, the Colorado River Delta now covers fewer than 150,000 acres. Besides small, dedicated environmental flows delivered pursuant to treaty agreements between the United States and Mexico, the only water flowing through the delta is agricultural runoff. More than 30 miles of riverbed are perennially dry.
But the delta is by no means lifeless; in fact, the runoff that feeds it has become a vital part of its ecosystem.
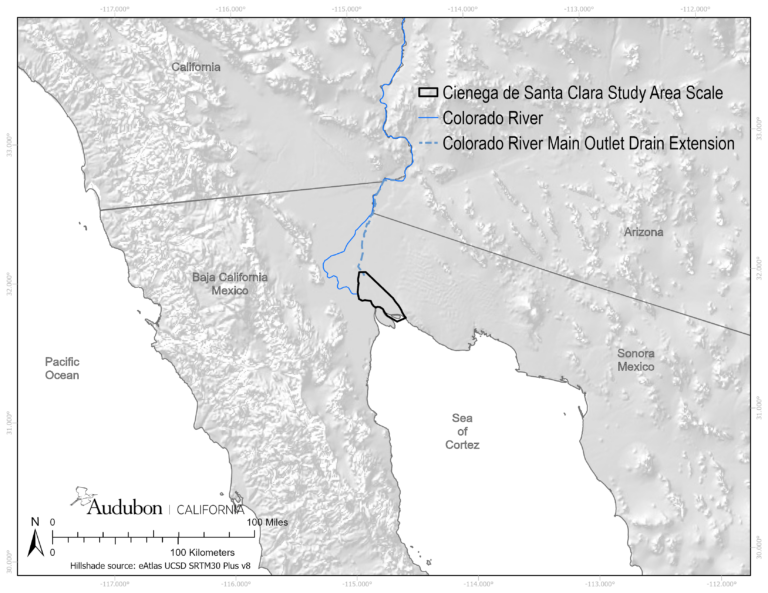
Take the Ciénega de Santa Clara, the largest remaining freshwater wetland in the delta. Created by water diversions from the Colorado River in 1976, the ciénega is sustained by the Wellton-Mohawk Irrigation & Drainage District’s Main Outlet Drain Extension (MODE), a concrete canal built to transport runoff from US farms into the delta. MODE now collects and transports more than 100,000 acre-feet of drainage water each year.
According to Daniel Orr, the director of geospatial science at the California state office of the National Audubon Society, this wetland supports habitats for more than 200,000 migratory waterbirds. However, because water flow to the wetland is regulated by both the US and Mexico, its future could be in jeopardy.
“Uncertainty in the volume and quality of this water supply causes concern that it could threaten sensitive habitats in the wetland,” said Orr.
Faced with that uncertainty, Orr and his team at the Audubon Society set out to assess and quantify bird habitats in and around the Ciénega de Santa Clara. By mapping out where these birds live and migrate, the team aimed to better understand the factors necessary to sustain the freshwater-dependent habitats in this area, and keep water flowing into the ciénega.
Imagery in Action
To analyze the sustainability of the wetland, Orr and his team began by identifying representative bird species that use the ciénega—often as a stopover on long migrations—and the periods of time when those species are present. They then grouped the bird species by associated habitat use, based on some of the team’s previous work around the Salton Sea.
The next step was assessing land cover in the ciénega. For this, the team used a combination of imagery analyses with the Forest-based Classification and Regression Tool in ArcGIS Pro.
“This allowed us to tell the ciénega’s story by defining and quantifying existing habitat components and values in the context of the birds [that the ciénega] supports,” said Orr.
The team integrated imagery from the European Space Agency’s Sentinel-2 satellites—which are used to map changes in land cover and monitor the earth’s forests—with the United States Geological Survey’s lidar data to derive elevation and topographic properties.
“Using raster tools [found in ArcGIS Pro], we created image mosaics for individual spectral bands,” said Orr. “We also created composite images and raster surfaces for a normalized difference vegetation index [NDVI] and a Modified Normalized Difference Water Index [MNDWI].”
These indexes are used to monitor vegetation and water levels in a given area over time, and were therefore critical in mapping the waterbirds’ habitats. Other geoprocessing tools in ArcGIS Pro were used to prepare and edit this data.
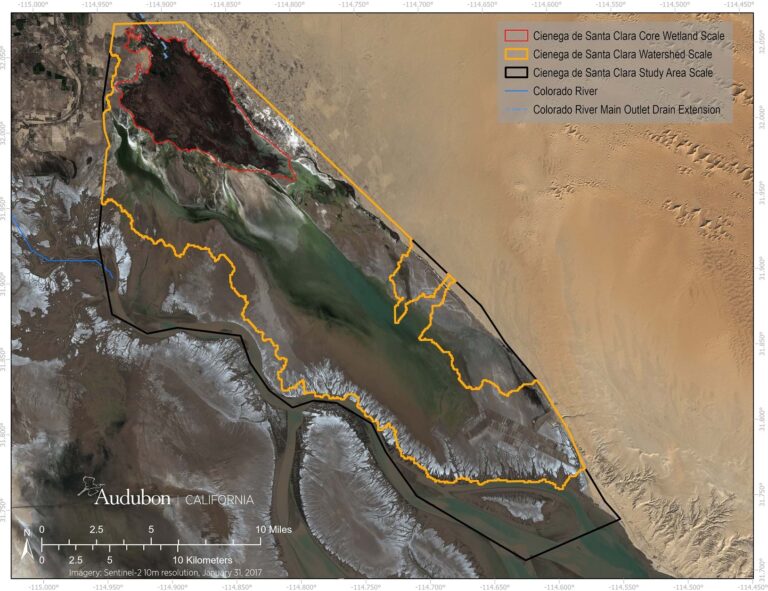
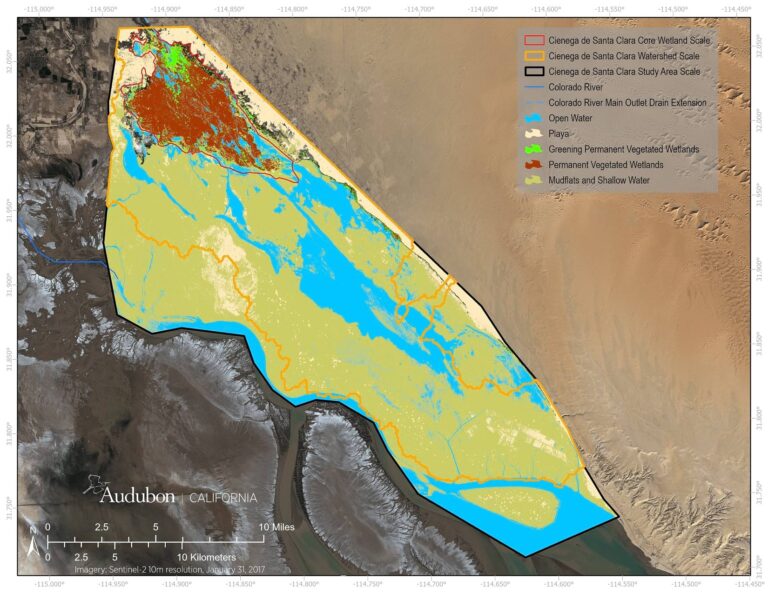
Orr and his team used machine learning to classify the imagery into land-cover categories corresponding to habitats associated with representative bird species groups. These habitats were quantified at three spatial scales: study area, watershed, and core wetland.
Migratory waterbirds depend on all these areas, but they have varying degrees of dependence on the diverted Colorado River water that flows into the study area.
The team assessed imagery from each season in 2017 and 2018, selected because these years were not impacted by water-flow delivery interruptions or large fires in the vegetated areas of the wetlands, and therefore provided an accurate analysis of migratory birds’ habitats.
“This gave us a land-cover model across two years and the four seasons for each year,” said Orr. “We then assessed the accuracy of the prediction of each successive model, [and] continued until we ultimately created a model that met our needs and expectations.”
A Model for Sustainability
The land-cover model not only provides a comprehensive picture of the ciénega’s resident birds, it also could make all the difference in their long-term survival. Because the agricultural runoff that feeds the wetland is by no means guaranteed, Orr hopes the model will justify maintaining the current water flow into the area.
“The Audubon Society and others will use the results to advocate for these important freshwater-dependent resources and the security of the water that these migratory birds depend on,” he said.
But the impact of this kind of spatial analysis doesn’t begin and end with the water security of the Ciénega de Santa Clara.
“[The] data and results could be useful and applied in a lot of ways,” Orr added. “I could see them being used for ecosystem valuation projects, habitat suitability modeling, or future habitat assessment.”
Orr also sees this project as a model for geospatial scientists to engage with conservation and policy professionals to understand an issue and, working together, find creative strategic solutions.
“We were able to work closely with our conservation teams and engage with teams on both sides of the border,” said Orr. “[We could] ensure we were doing spatial analyses that would make a difference and be used in a variety of ways.”
Furthermore, Orr’s team created a repeatable process. “The machine learning, modeling, and geoprocessing workflow is all there,” he said. “This gives advocacy groups, scientists, and policy teams a tool to assess future habitats, document ecosystem and habitat changes, [and] monitor habitat availability over the long term.”
