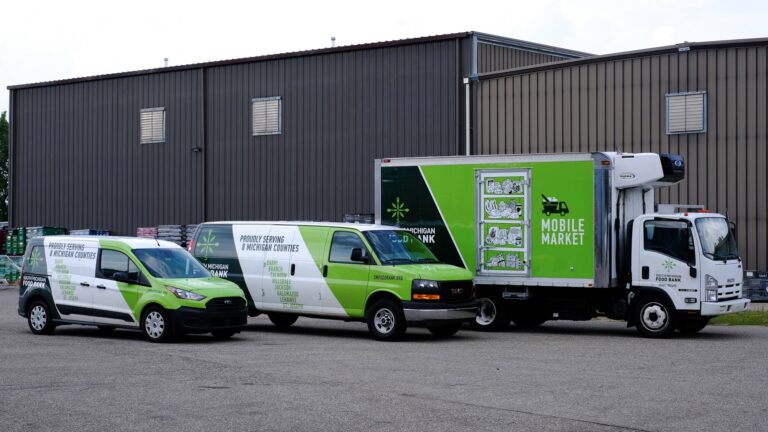
The South Michigan Food Bank, one of seven food banks in the state of Michigan, distributes over 11 million pounds of food each year, providing meals for families and individuals across eight counties. The organization partners with schools, churches, and other nonprofit organizations to set up food pantries and distribute fresh food to those most in need.
But ensuring resources get where they’re most needed is no easy task. One of the main challenges, according to South Michigan Food Bank CEO Peter Vogel, is a lack of data about Michigan residents who could benefit the most from the services the food bank provides and where those residents are located. This can hinder food banks when it comes to making targeted decisions about distributions or obtaining grants.
“We have a lot of options and a lot of locations where people can get food that we’re acquiring,” said Vogel. “But [there are] those who have transportation challenges and can’t get to those locations. Where are they? How many of them are there?”
Vogel turned to Dr. Stephen Borders, director of health administration programs at Coastal Carolina University, to help address this. Borders, who had previously worked with the Food Bank Council of Michigan, understood the need for a shift in how food banks acquire and distribute resources, and shared Vogel’s vision for a strategy to combat food insecurity that was driven by geographic data.
“I’ve been trying to figure out how to build a food bank that our community needs for the future,” said Vogel, “Every time there’s a downturn in the economy, resources to food banks dry up. We’ve been trying to build a business model that is sustainable and prepares us for [economic] downturns.”
“It’s not what we’ve always necessarily done,” he added, “but what it needs going forward.”
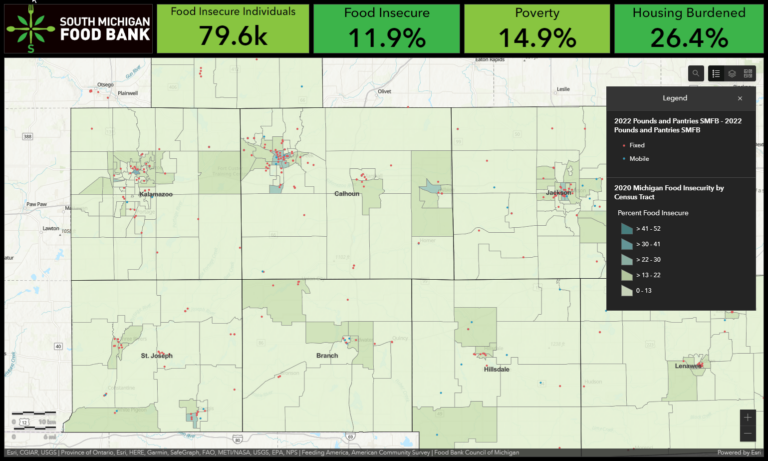
Borders’ solution was a dashboard, created with ArcGIS Dashboards, that would allow the South Michigan Food Bank to visualize crucial information about the counties it serves—and, therefore, make better-informed choices when it comes to tackling food insecurity in the region.
Fed by Data
Thanks in part to an educational grant available to educators in Horry County, South Carolina, Borders was able to enlist the help of Coastal Carolina University students, such as Mackenzie Cannon, who proved invaluable in building and expanding the food bank’s dashboard and were able to come away with plenty of hands-on experience.
Cannon was new to ArcGIS Dashboards but took to the software quickly. “Once you figure out all the pieces, it’s really amazing what that program is able to do and how it’s able to help the South Michigan Food Bank,” she said.
Beginning in August 2022, Borders and his team began by extracting data from the US Census Bureau, focusing on what would be most useful for the project, including housing burden, poverty, food insecurity, and food deserts—urban areas with a dearth of affordable or high-quality fresh food. The data came from sources such as Feeding America, which generates food insecurity estimates, and the US Department of Agriculture (USDA).
“We were just trying to get the data right,” said Borders. “What is it that they’re really interested in? What are the key indicators?”
From there, they used an Excel spreadsheet to import the data into the dashboard and built infographics using ArcGIS Business Analyst to display the data interactively.
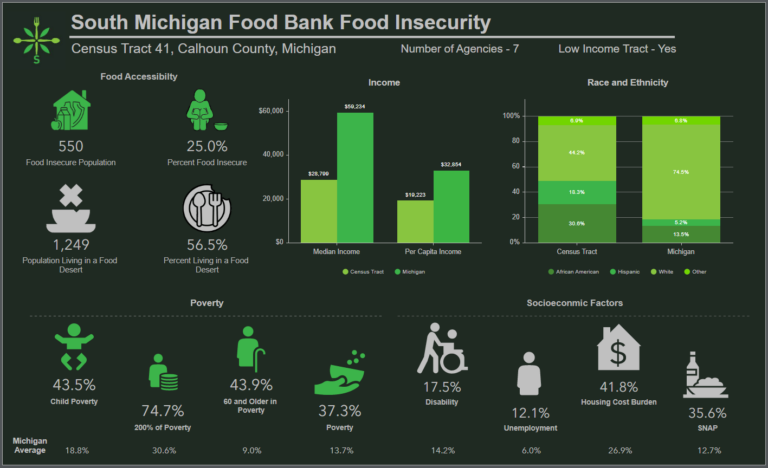
“We created infographics for every census tract,” said Borders. “Once you start looking at those, you see that food insecurity is different in Kalamazoo than it is in Battle Creek. Then you get to the rural areas where the dynamics are very different.”
Transportation, for instance, is a major issue for residents of rural areas who may be located farther from food pantry locations and one of many factors that needed to be highlighted in the dashboard to best illustrate the needs of each area.
“All those things were easy to do within the program,” said Borders. “You have this dynamic dashboard that says, ‘If we look at the entire community, here’s what food insecurity looks like.’ But as we change the extent on that map, we get a different view of Kalamazoo and Battle Creek.”
By January 2023, the dashboard was ready to go live, and the South Michigan Food Bank hit the ground running.
From Dashboard to Table
One of the most important functions of the dashboard so far has been to help the food bank scout new locations for food pantries. Existing pantry locations, rather than the areas of highest need, have historically determined how food bank resources are distributed. But being able to visualize data about food insecurity has allowed the South Michigan Food Bank to make more targeted decisions about its distributions, including how frequently they occur.
“We’re recruiting pantries in areas where we know we need to put more food,” said Vogel. “It’s much smarter and better for the community, but we didn’t really have the data to help us make those decisions in the past.”
Moreover, the dashboard has been vital from an outreach perspective. Not only is the dashboard instrumental in educating residents and potential partner organizations within the communities the food bank serves, but it has also been a crucial part of seeking new statewide grants that could provide the food bank with resources it hadn’t been able to pursue previously.
“It’s giving us a chance to really grow that program. [We’re] trying to get healthier foods out to people, trying to partner with the local farmers to really make a difference—to throw some income their way that they might not have otherwise,” said Vogel.
As the successes of a data-driven program compound, Borders and his team have begun looking to the future—including the possibility of expanding the dashboard to include other Michigan food banks.
“Now that we know how to do it, we’re feeling a lot better about the model and the utility of it,” said Borders. “We’ve talked about [including] trends. What does poverty look like in each area? Is it getting worse or is it getting better? The goal is to help think about long-term planning.”
But it’s already clear how much this dashboard—and the data-driven approach that led to its creation—has benefitted not only the South Michigan Food Bank but also Borders as an educator, as well as the students who worked with him to make it a reality.
“What a wonderful thing for nonprofits to have that really low-cost product,” said Borders, “and for us at the university to be able to teach with it, to be able to do real, lasting work.”