The Esri User Conference Highlights the Creativity and Technology Needed to Solve Challenging Issues
Despite a worldwide pandemic, Esri brought the 2020 Esri User Conference (Esri UC) to the people.
More than 88,000 registrants from around the world watched the first virtual Esri UC online, tuning in from home offices; backyards; meeting rooms; and, in at least one case, a camper in the woods of Wisconsin. In New Zealand, where the number of cases of coronavirus disease 2019 (COVID-19) were practically nil at the time, employees of one organization were able to gather in an auditorium.
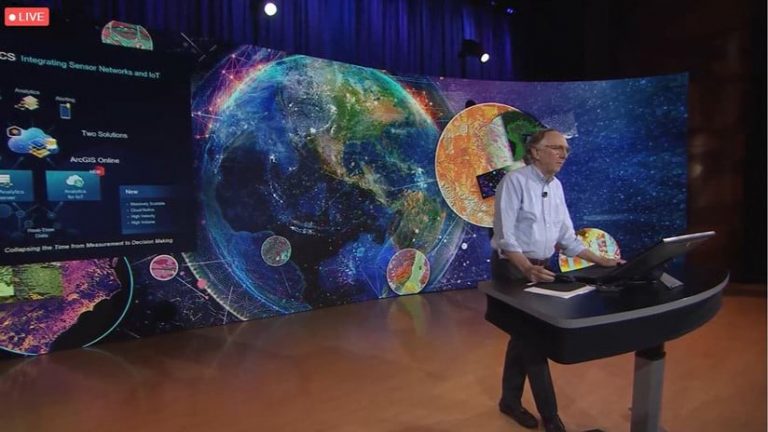
Esri president Jack Dangermond, speaking live from Esri headquarters in Redlands, California, thanked attendees for the valuable and remarkable work they do with GIS, even in the face of what’s confronting society today.
The times are challenging because of COVID-19, Dangermond said, citing the impact of the disease on people’s health, jobs, and the economy. He added that society also is facing other challenges: racial disparities and inequities; political polarization; climate change; and overpopulation.
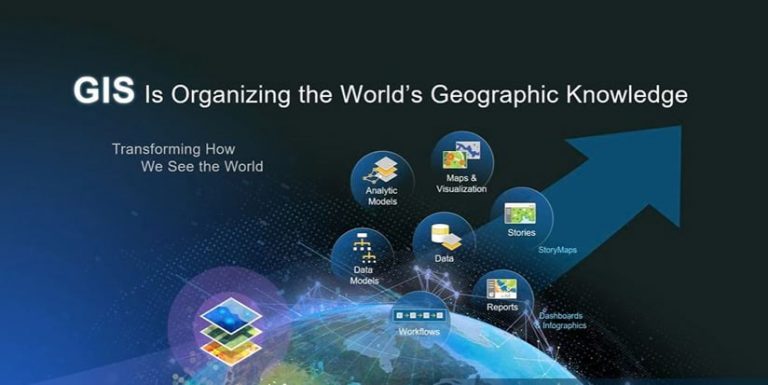
However, the GIS community is science, analytics, and solutions oriented and working on issues like these. That tied into the theme of the conference: GIS—Interconnecting Our World. One of the aspects of that theme relates to using geographic science to better understand complex issues and solve problems.
Overcoming these problems will require better understanding, communication, and collaboration, along with the best science, technology, problem-solving, and design thinking, according to Dangermond.
“Geography, our science; GIS, the technology; and you, the geospatial community, will be essential in creating what I would describe as a geospatially literate society [to work on these issues],” he said.
Dangermond said he gets inspired by the work that ArcGIS users do.
“I like to think of you as a global community, and the footprints of the amazing work that you are doing . . . is energizing to me,” Dangermond said. “Every day I wake up, I have the same sense of purpose that I had 50 years ago as a young student starting Esri.”
Dangermond senses that same type of dedication among the people who use GIS technology. “I know somehow that many of you have had those lights turn on in your life, and there’s no turning back because it’s a powerful, important thing that you are doing,” he said.
Forty years ago, 11 people met in Redlands for the first Esri UC. Though the number of attendees was minuscule compared to today and the gathering in person rather than virtual, the event’s purpose remains the same: share work, make new friends, get inspired, and have fun.
Much of that was still done online through the virtual platform of the 2020 Esri UC. Created especially for this year’s event, 2020 Esri UC is where registered attendees accessed the Plenary Session livestream (which was also available to anyone via the Esri website), technical sessions, special interest group (SIG) meetings, a virtual Expo, the Map Gallery, and a networking app. Although many users expressed disappointment at not being able to be together in San Diego, California, many found the silver lining in being able to attend the event virtually.
“Attending [the] #EsriUC conference has always been a dream,” said Chidimma Umeogu from Awka, Nigeria, in a post on Twitter. A PhD student and assistant lecturer at Nnamdi Azikiwe University and cofounder of African Women in GIS, Umeogu said in an interview that although she has always wanted to attend the Esri UC, it would be “a Herculean task” without sponsorship.
“It’s being made virtual this year due to the pandemic granted [those of] us from low-income countries the opportunity to participate, network, and have a virtual experience of what the Esri UC is all about,” she said. “The experience made me feel more connected to the GIS industry and to all the key players.”

Brandi LeRoy, a high school geography, history, and GIS teacher from Bangor, Maine, attended the Esri UC two years ago. Although she prefers the in-person event, she was glad to get to join in this year.
“It’s always good to hear from Jack and see what’s new with ArcGIS technology—especially before I get in the classroom with students,” she said. “It’s really helpful to see how people use GIS in other fields, since that’s part of what I want to show my students—how far-reaching the technology is.”

Examples of this far-reaching technology were shared during the Plenary Session. Dangermond reviewed thousands of map submissions and highlighted several that stood out in a variety of fields and industries: whale tracking off the coast of Alaska, Arctic biodiversity, honeybee colonization, housing for homeless residents, indoor space management, infrastructure planning, and water consumption and quality.
Many maps caught Dangermond’s eye, including one of network availability, especially important during the COVID-19 pandemic. “Network access to the internet in these times, particularly where kids have to stay home, can define the digital divide,” he said.
Dangermond also highlighted work being done using census and public health data, with organizations creating maps related to social equity, racial and ethnic disparities linked to COVID-19, and lack of access to healthy food.
Many COVID-19 maps and dashboards have been produced, too, such as those showing numbers of cases and deaths, information about hospital admissions and patient status, and analysis of sidewalks to meet social distancing rules.
Esri’s chief medical officer Este Geraghty and director of public safety and disaster response Ryan Lanclos highlighted a handful of COVID-19-related maps and dashboards from around the world. And to help people and organizations continue to use geospatial technology to tackle the pandemic and its residual effects, Esri released three new GIS capabilities: time series forecasting and community contact tracing in ArcGIS Pro and space planning in ArcGIS Indoors.
Learn more about them by watching the presentations by spatial analysis and data science software team lead Lauren Bennett and solution engineers Amanda Stanko and Juhan Yoon.
GIS—Interconnecting Our World
The conference theme underscores intertwined trends, including the increasing ease of use of GIS applications, the growing real-time aspect of the technology, the spike in geospatial hubs to promote community engagement, and the growth of interconnected systems that create geospatial infrastructure.
Dangermond emphasized the importance of geospatial infrastructure, where individual systems are starting to link together and share content and capabilities. This is leading to increasing collaboration within and among organizations.
He cited as an example Pacific Gas & Electric in Northern California—one of the largest utilities in the world—now sharing its outage information and emergency information with the State of California via the California Public Utilities Commission. In turn, the state shares fire and other emergency information with the utility.
Dangermond underscored the need to use geographic science to tackle interconnected problems: environmental degradation, social instability, climate change, natural disasters, loss of nature, and overpopulation. “Addressing these issues is going to be challenging for you and for me for the rest of our lives,” he said.
Feedback from Customers Drives Changes in ArcGIS
Esri is constantly adding new capabilities to ArcGIS, often based on users’ feedback.
“Our main purpose as we see our organization is to build tools that help you do your work better,” said Dangermond. “The vision for ArcGIS is to build a comprehensive geospatial platform that supports multiple communities.”
Dangermond highlighted many advances in ArcGIS, including the integration of ArcGIS Notebooks, Esri’s spatially optimized Jupyter Notebook experience, now available with ArcGIS Pro, ArcGIS Enterprise and ArcGIS Online.
He also noted that the new cloud-based Site Scan for ArcGIS for drone flight planning, image processing, and analysis, is now available.
Esri introduced the new Suitability Modeler tool in ArcGIS Pro, demonstrated by Yoon. Suitability modeling has several applications, such as site selection and planning.
Yoon used the Suitability Modeler capability to find the best locations to grow coffee, Hawaii’s second most harvested crop, on the island of Maui. Since coffee requires certain conditions to grow such as flat and low-sloped areas, finding suitable land can be a challenge.
However, Yoon did it by adding several data layers to his model such as land cover, slope, aspect, soil type, annual precipitation, annual air temperature, and andisol percentage (soil high in volcanic ash).
He demonstrated the simplicity of using various tools in the Suitability Modeler. As he added different layers, the maps in his model updated on the fly.
To finish the analysis, Yoon used the Locate function to find the 640 acres, divided into two sections, that were most suitable for growing coffee on Maui: A piece of land owned by a ranching company in the middle of the island.
See Yoon’s presentation by watching this video.
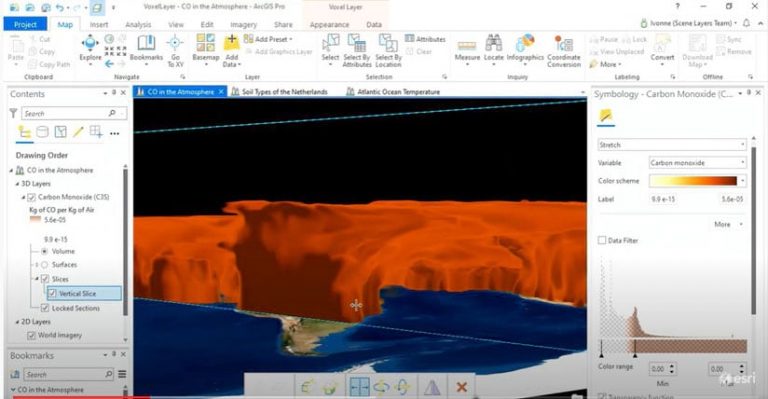
Ivonne Seler, the 3D program manager and product owner of scene layers at Esri, demonstrated 3D voxel layers in ArcGIS Pro. 3D voxels offer a stunning new way to visualize and understand complex, multidimensional data as they are 3-dimensional cubes that can store a variety of data.
She showcased an example of carbon monoxide distribution in the atmosphere.
“You can slice through the voxel volume to discover information hidden inside,” Seler said. “What makes voxel layers so powerful is how easy it is to visualize [data] in 3D.”
Watch this video to see Seler’s presentation in its entirety.
To highlight the connections between Esri technology, users’ expertise, and Dangermond’s vision for GIS, Plenary Session attendees also got to tour some additional capabilities in ArcGIS Pro.
Michelle Viengvilay, a solution engineer who works with Esri’s partner community, showed the audience new map graphics in ArcGIS Pro 2.6.
Zooming in to a map of the Galapagos Islands, Ecuador—the only place north of the equator where penguins live—Viengvilay used the Add Graphics Layer tool to style a map that marks penguin habitats and identifies why they’re located on the archipelago.
Viengvilay also demonstrated the latest integration in ArcGIS: the ability to seamlessly interact with engineering files stored in Autodesk BIM 360. Using ArcGIS Pro, she downloaded a CAD file for a new office building and added it to a map along with water utility network data. She also showed how easy it is to get updated design files and perform a network trace.
Watch the full tour of new ArcGIS Pro capabilities.
Other advanced tools from across the platform were featured in the Plenary Session as well, including new raster analysis tools that let users detect, analyze, and predict change over space and time.
Imagery product manager Vinay Viswambharan showed viewers how to use two new multidimensional raster tools—one that analyzes trends, and one that does predictive analysis.
In his example, he looked at sea surface temperature data over the last 35 years. Using an image cube that contains more than 2,000 slices of sea surface temperature data, Viswambharan extracted trend information over time from every pixel within the cube. On a global map, the resultant red spots showed where temperature trends are increasing, mainly due to climate change. Next, he used the Prediction tool to analyze sea surface trends to 2030.
This is the first time you can perform predictive analysis on large-scale raster data, with processing that is done on the fly, according to Viswambharan.
Watch Viswambharan’s presentation.
Shannon Kalisky, lead product manager for analytics and data science, showed how Esri is continuing to integrate new deep learning models and frameworks to make it easier for users to get started working with them. There are now 15 deep learning models included in ArcGIS API for Python. (Learn more.)
“All you have to do is pick a model that fits your problem and start training,” she said.
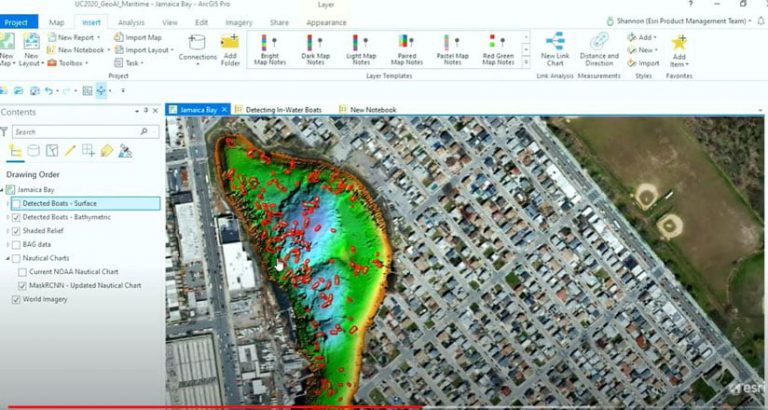
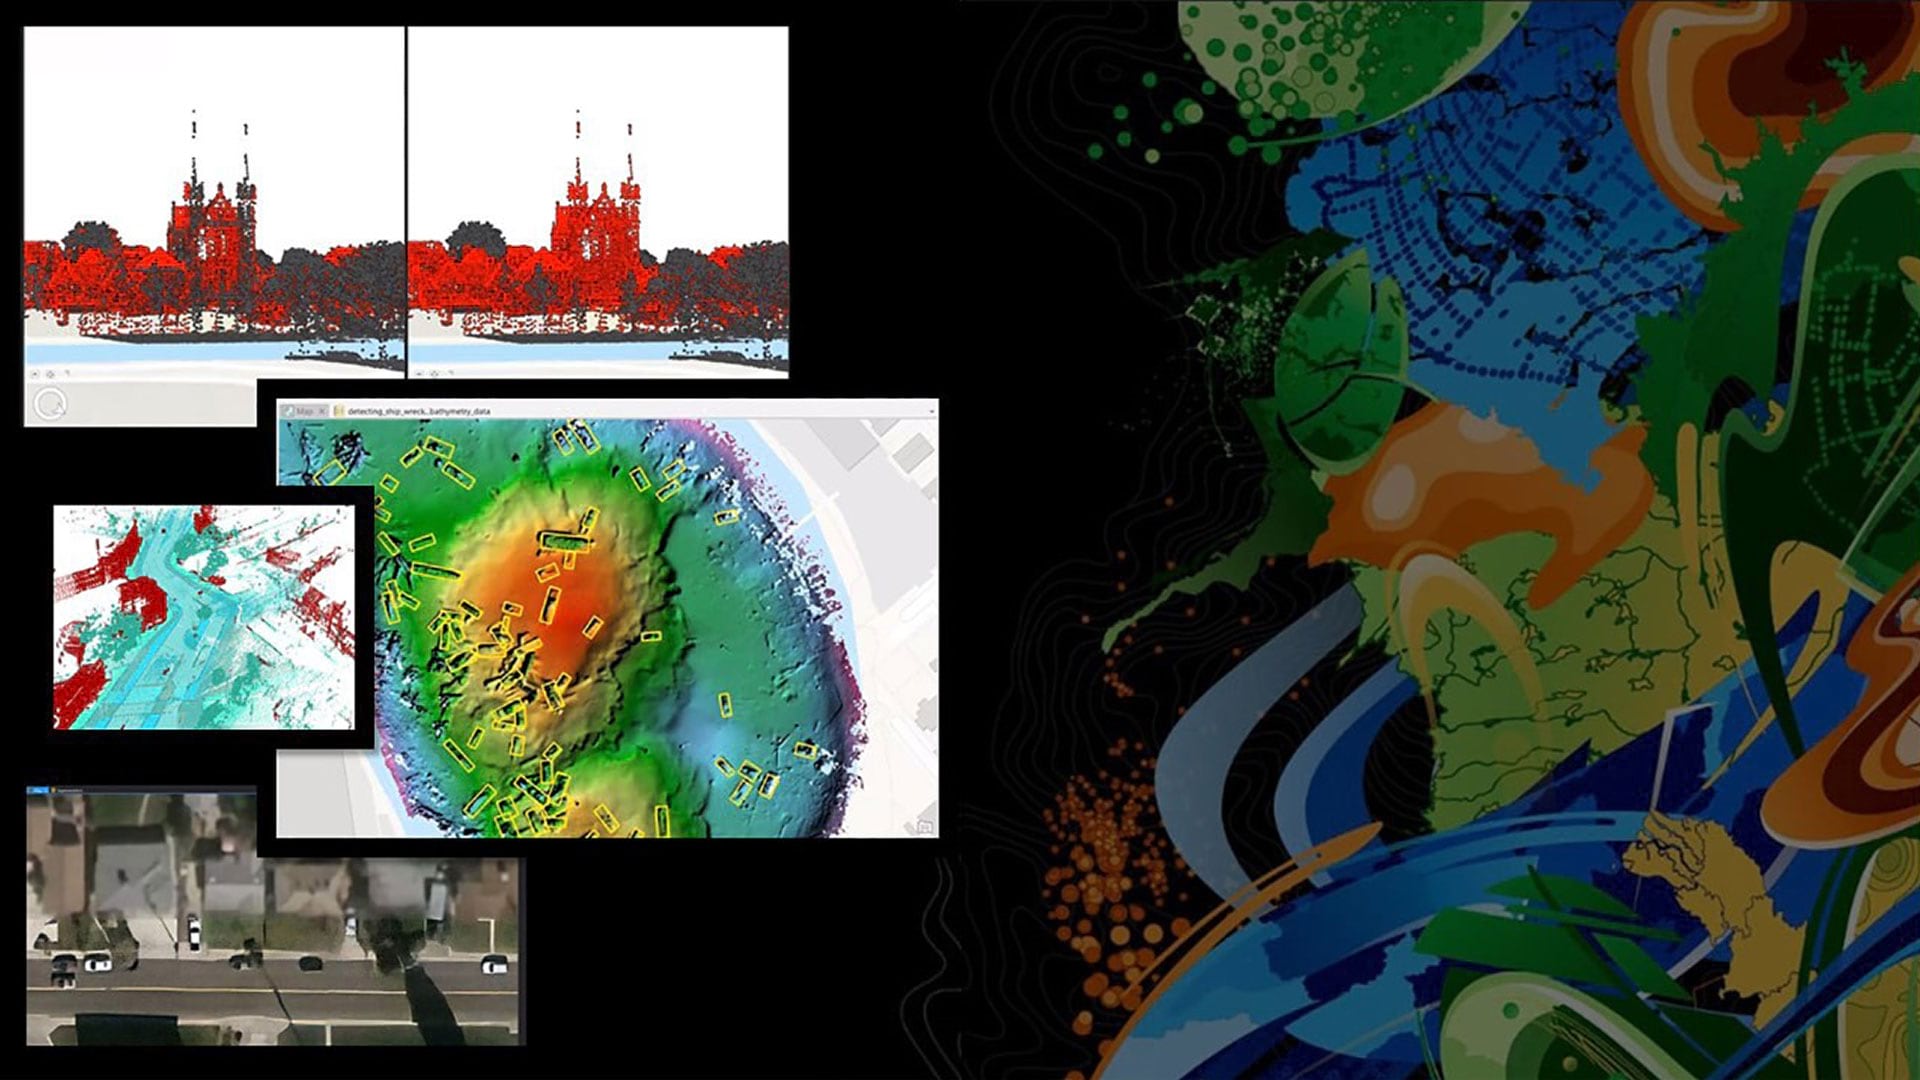
Kalisky took viewers to a map of Jamaica Bay, New York, and used deep learning to detect boats in the bay. Kalisky first brought in ground truth data to teach the model what to look for. She then selected the model she wanted to use, called MaskRCNN, and started the training process. Using the built-in learning rate finder to identify an optimal learning rate, Kalisky let the model do the training and then she validated the results. The model did exactly what Kalisky wanted it to do: it identified all the boats in the water and left out any boats on land.
“Now, when we get updated imagery in the area, all we need to do is rerun our model, and we’ll get an updated feature class of boats in the bay,” she said.
However, what if you need to analyze something that sits beneath the surface?
“In 2012, Superstorm Sandy hit this area pretty hard, and . . . hundreds of ships sank,” Kalisky said.
Using the same deep learning process and model, Kalisky created a new workflow to identify the sunken boats. She even used the features generated by the model to update the nautical charts in the area, “making quick work of an ordinarily manual task.”
To watch all the Plenary Session videos, visit the Esri Events YouTube channel.