The Carlton County, Minnesota, GIS Team Used Esri ArcGIS to Digitize the Drive-Through Clinic’s Administrative Process
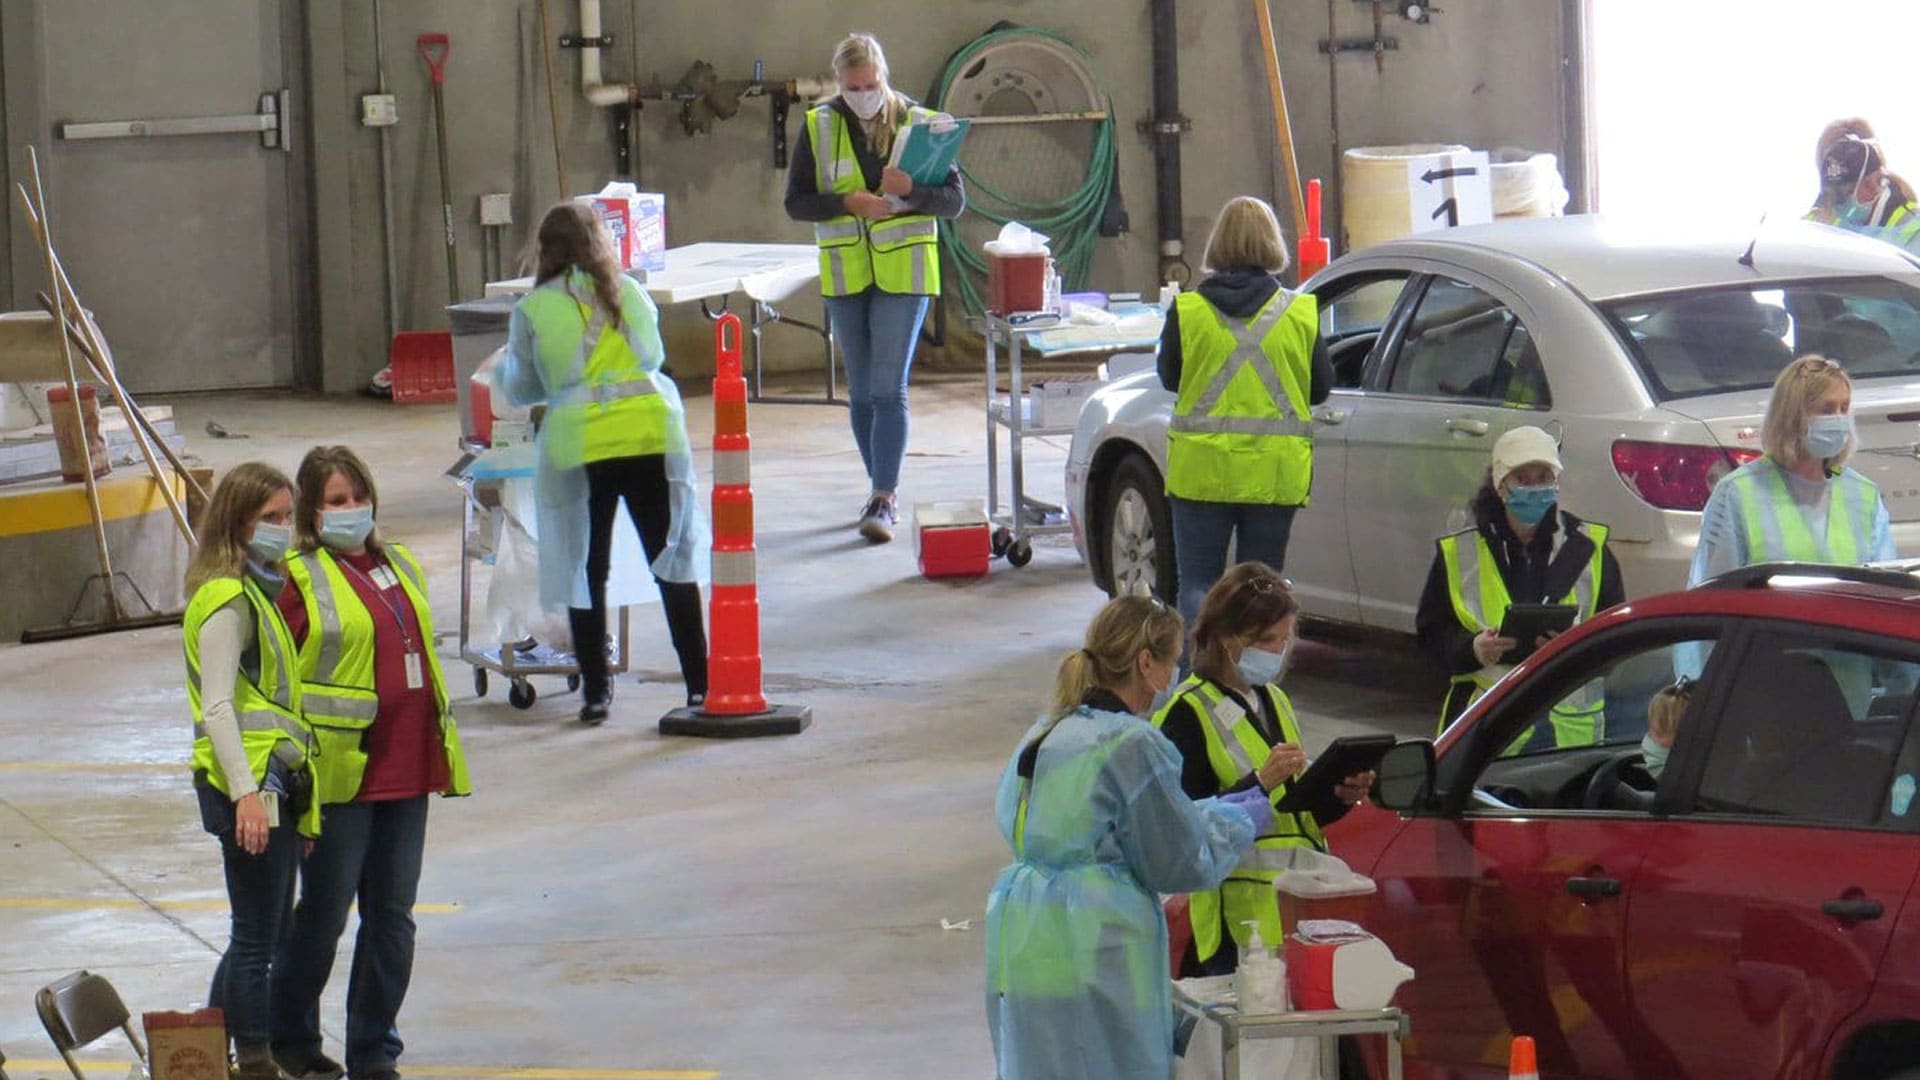
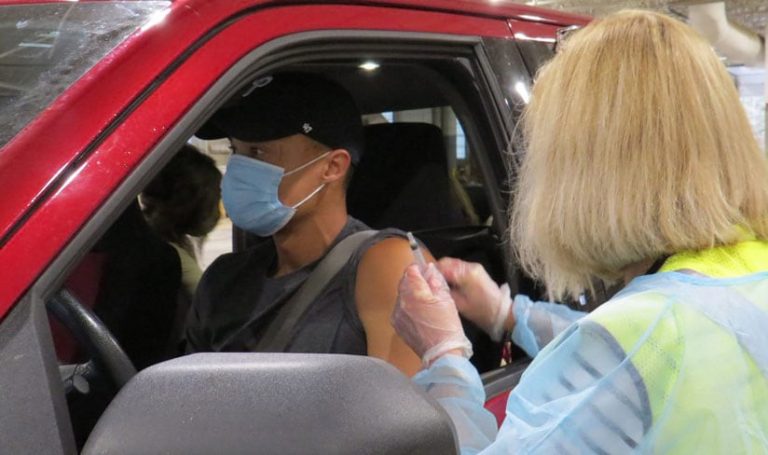
When the coronavirus disease 2019 (COVID-19) pandemic threw a wrench into plans to host traditional walk-in influenza vaccine clinics, Carlton County, Minnesota, officials decided to go the safer, socially distanced route: sponsor a drive-through flu clinic where people could get vaccinated in their vehicles.
But one problem remained: flu vaccine consent and screening information forms needed to be filled out. This meant that in addition to those getting vaccinated, multiple people—from volunteers to nurses—would have to touch pens and paper forms as they were passed back and forth.
When GIS technician Siona Roberts learned about this problem during a Carlton County Public Health & Human Services COVID-19 response team meeting, she thought that a GIS data collection app just might be the perfect solution. “A lightbulb went off,” Roberts said. “We could use ArcGIS Survey123 to do this.”
Getting people to fill out the vaccination forms digitally, either before or during their visit to the drive-through clinic, would reduce the potential for COVID-19 being passed from one person to another. In addition to digital collection of information at the clinic, everyone there would wear masks and the staff administering the vaccines would wear personal protective equipment (PPE).
The project was a collaborative effort. There was input from the Carlton County GIS Department, Public Health & Human Services, Sheriff’s Office, Land Department, Transportation Department, Building Maintenance Department, and Information Technology (IT) Department. Together the team members began creating location technology-based solutions that would eliminate concerns related to COVID-19 transmission, such as standing in line with others, sharing pens, and having multiple people touch paper forms.
Clinic Goes Digital
Roberts recently began working with GIS coordinator Jared Hovi, who had been the lone GIS professional at the Carlton County Land Department since 2008. Together they have been using Esri ArcGIS to manage land records, help develop data for next generation 9-1-1 systems, and create a variety of new apps for the county.
Hovi said Carlton County has an Esri Small Municipal and County Government Enterprise Agreement, which includes ArcGIS Online. ArcGIS Online comes with software such as ArcGIS Survey123, ArcGIS Hub Basic, and ArcGIS Dashboards. All were eventually used for the drive-through flu clinic project.
Because of the COVID-19 public health threat and the availability of GIS technology, Carlton County Public Health & Human Services—which serves 36,000 residents in northeastern Minnesota—decided to go all digital for its drive-through flu clinic in September 2020, except for the administration of the vaccines, of course. Last summer, when planning was under way for the flu clinic, the county was expecting a spike in COVID-19 cases that fall. (As of February 8, 2021, there were 2,515 confirmed and 425 probable COVID-19 cases in Carlton County and 43 deaths.)
“We had a complex situation,” said Jenny Barta, a public health nurse specialist for Carlton County Public Health & Human Services and a registered nurse. “We thought, ‘We have to keep people separated and far apart.'”
The clinic was scheduled for September 25 and 26, 2020, with preregistration starting a week earlier. So by August, Roberts and Hovi had begun to strategize and then configure and test the apps.
The ArcGIS Survey123 forms would be the linchpin of this new flu clinic model and for the COVID-19 vaccine distribution process that would occur later in the year. (Read the Time magazine article that describes the use of Esri technology for the COVID-19 vaccinations in Carlton County).
Online forms would make registration for the flu clinic faster and easier for the public and provide real-time statistics, enabling county officials to quickly analyze how many people were being vaccinated and how fast this was being done. Preregistration forms would also help the county determine clinic attendance as well as how many people would be needed to staff it. Important information about individuals receiving the flu vaccine—such as which type of vaccine they received—could be stored and accessed rapidly, and responses could be standardized to avoid data entry errors. The county’s IT staff also played a vital role in making plans, preparing Apple iPads, and ensuring that robust Wi-Fi coverage was in place.
Hovi and Roberts used ArcGIS Hub to create the Carlton County Drive-Through Flu Vaccine Clinic site with basic details such as the dates and times of the event and contact information. (A link to that site was shared on the main Carlton County website, on the county’s Facebook page, and with local media).
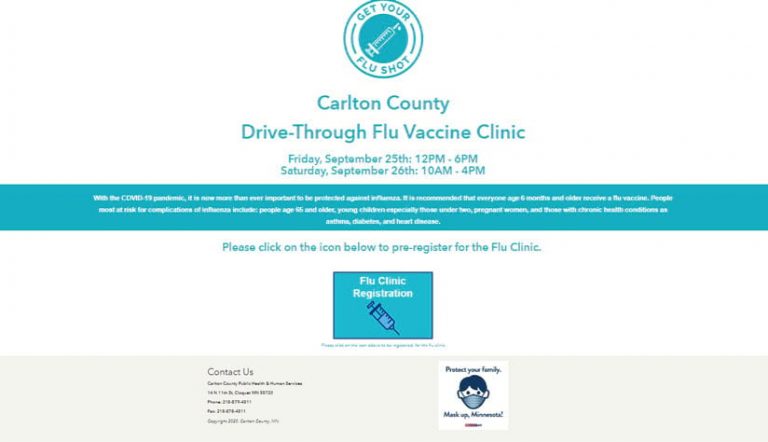
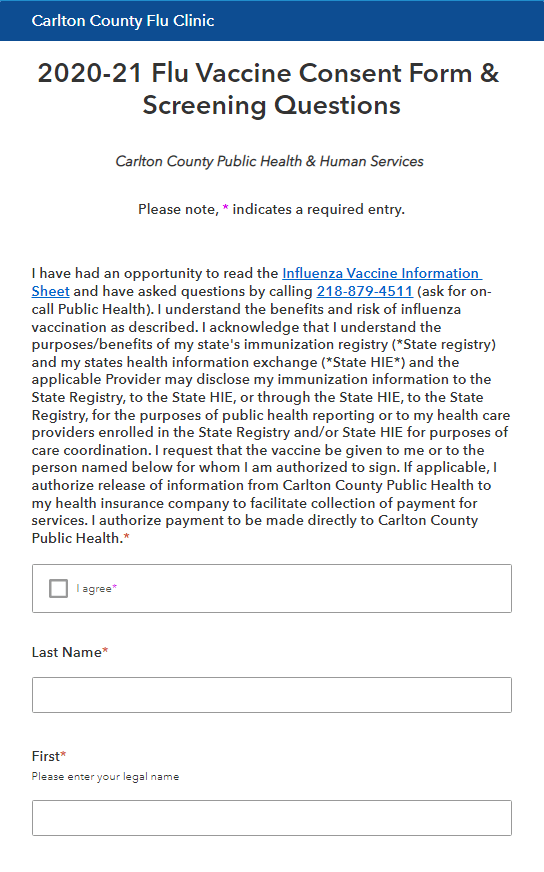
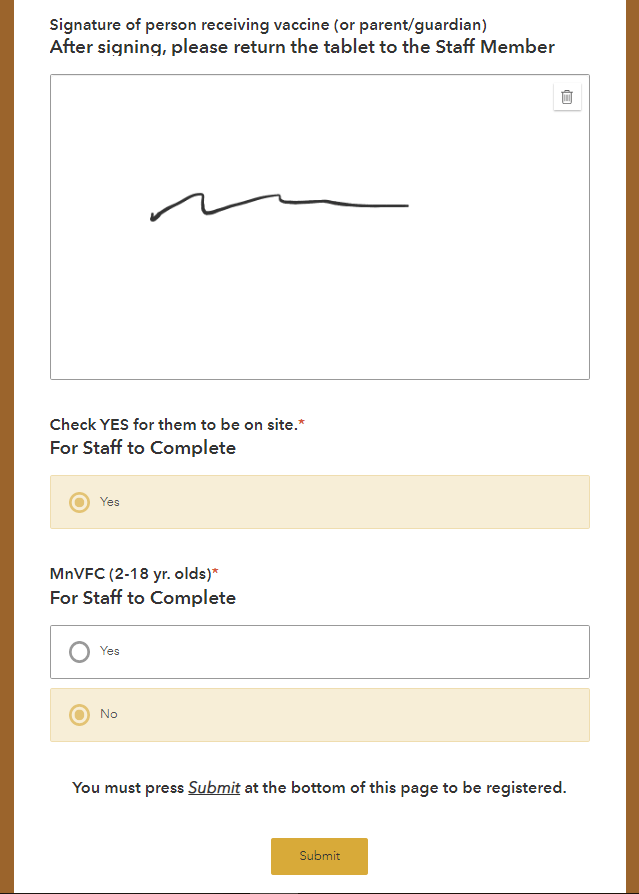
The Hub site also included a flu clinic registration icon. Clicking the icon opened an ArcGIS Survey123 form that needed to be filled out with all the pertinent personal and insurance- and health-related information that registrants were required to provide. The flu vaccine consent and screening questionnaire asked for each registrant’s name, address, insurance status, and telephone number and included questions such as whether they were currently ill and whether they had an allergy to eggs or a component of the influenza vaccine.
Hovi and Roberts configured three additional ArcGIS Survey123 forms for the flu clinic:
- An on-site registration form—used for those who were unable to preregister, and completed by Carlton County staff with the use of iPads—that enabled participants to register as they waited in line in their cars to receive their vaccines
- A check-in form for providing information such as the participant’s name, date of birth, telephone number, and insurance status and, if applicable, the name of their insurance company
- A vaccine administration form, used to record critical details about the vaccine that the participant received
Also, a QR Code was generated, which was displayed for vehicles entering the Carlton County Department of Transportation building in Carlton, Minnesota, where the drive-through clinic was held. By scanning the code using their smartphones, participants got easy access to the preregistration form.
For the drive-through COVID-19 vaccination clinic held December 29, 2020, residents who qualified for the vaccine were emailed preregistration information that included a URL to the ArcGIS Survey123 form. If they didn’t preregister, they could access the form by scanning a QR code at the Carlton County Department of Transportation building when they arrived to get their vaccination. Seventy vaccine doses were administered on December 29.
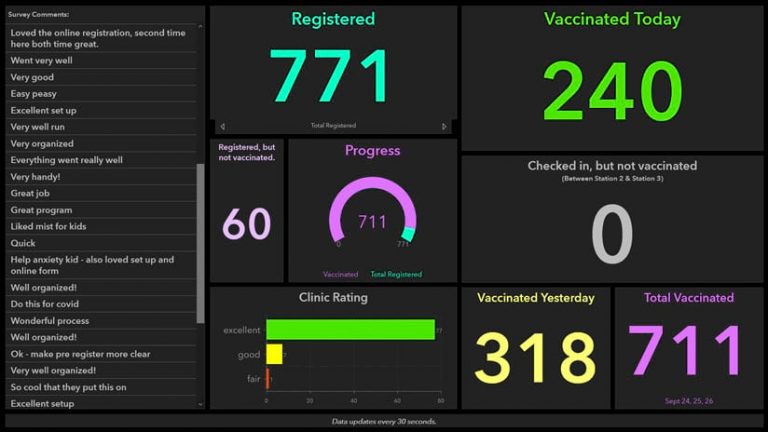
Dashboards were configured for the clinic’s registration and vaccination stations, providing real-time insight on the number of people registered, how many were vaccinated each day, and how many registered but were not yet vaccinated. Traffic flow was also reflected in the dashboard statistics; graphs showed, by time and date, how many people registered, and—by hour—how many participants came in. (The same type of dashboards were configured for the COVID-19 vaccination clinic in December.)
For many of the clinic staff, the most valuable dashboard was the one that displayed ratings given by vaccine recipients who participated in a survey after their visit. Displayed on a 50-inch screen that could be easily seen by the staff at the building that hosted the drive-through event, the dashboard provided a barometer of success for the new clinic format, based on feedback from the public. The dashboard also showed comments submitted during the survey such as “quick” and “wonderful process” as well as “very well organized!” and “Do this for [COVID-19]!”

What made the project interesting to Roberts was that there was no location data to work with. “When you think about GIS, you think about a spatial component,” she said. “There was no spatial component to the flu products.”
That also made the project a challenge, according to Hovi.
For example, the location of registrants wasn’t captured when they filled out the ArcGIS Survey123 forms, ensuring privacy. While ArcGIS Survey123 does generate a shape field (which contains the geometry of a feature), the GIS team ensured that registrants’ forms did not require a logged location by storing 0,0 in that field.
“We took the geospatial component completely out of it and just worked with tabular data,” Hovi said. “It led to some creative thinking. We knew we could put it together and make it work.”
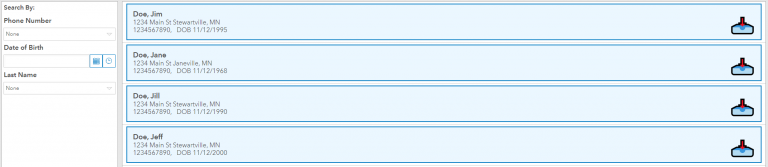
A lot of work went into setting up some of the dashboards. For example, clinic staff used ArcGIS Dashboards to check people in to the clinic who had already registered. As people submitted their ArcGIS Survey123 forms online in the days leading up to the event, the information collected was fed into a secured feature class hosted on the county’s GIS server, which could then be accessed using ArcGIS Dashboards. Hovi said that during check-in, a volunteer with ArcGIS Dashboards on an iPad could just ask for a registrant’s telephone number, type that number in a search box, and retrieve that person’s registration information. Telephone numbers were used for searches because using a name, said Hovi, could turn up multiple people with the same name.
Success with GIS
Barta said that the flu clinic was wildly successful, with 711 people getting vaccinations out of the 771 people who had registered. Plus, the county finally made the switch to digital forms, something Barta said she knew needed to be done at some point in time.
That digital process helped speed people through the clinic too. For the people who had preregistered, the average time for getting a vaccine—from the time they checked in up to the time they exited the garage—was only about five minutes, Barta said.
“The turnout was excellent. This was by far the most people we have vaccinated [during the annual clinic],” said Barta, crediting both the smooth online registration process using GIS technology and the strong outreach to local media, school officials, and county employees.
Perhaps an even greater long-term benefit was that the drive-through flu clinic marked the first time the Carlton County GIS team worked on a public health project, portending even more opportunities for collaboration in the future.
Barta said the information about the project was shared with the Carlton County Board of Commissioners, who have been shown the dashboards and have seen “the ingenuity of our GIS team.”
To learn more about the Carlton County flu clinic, view the ArcGIS StoryMaps story called A Flu Clinic for a New Era created by Carlton County with Esri partner Pro-West & Associates.