
Apps Such as ArcGIS Dashboards and ArcGIS QuickCapture Help Officials Securely Manage and Track Real-Time Election Data
Voting in this year’s elections in the United States was vastly different from how it used to be, because many citizens opted to vote by mail due to concerns about being exposed to coronavirus disease 2019 (COVID-19). Whether people ultimately decided to vote in person, mail in their ballots, or deliver them to drop boxes, one county in Utah realized there was a desperate need to modernize its antiquated, time-consuming election processes.
Utah County, the second largest county in the state, used GIS to transform its outdated election processes into a modern, location-enabled system. ArcGIS Solutions for Local Government—Elections from Esri helped the county support a secure and efficient process for collecting ballots from drop boxes and quickly sharing the results of the vote after the polls closed.
The Utah County elections department collaborated with the county’s GIS team to eliminate hours of staff time typically spent updating results on election night, and developed an efficient process to collect ballots from drop boxes across 2,144 square miles.
Providing the Public with Real-Time Results
Prior to implementing the elections solution, the county used a standard tabulated document that showed the number of votes cast per candidate. Unfortunately, this system lacked a point of reference to indicate which candidates won in which precincts, and it had no visualization capabilities.
Utah County’s GIS analyst, Andrea Befus, understood the need to create an elections dashboard to allow residents to view election results in near real time, in an easy-to-understand format. To create this dashboard, Befus embedded ArcGIS Dashboards into a classic Esri Story Maps Map Series template.
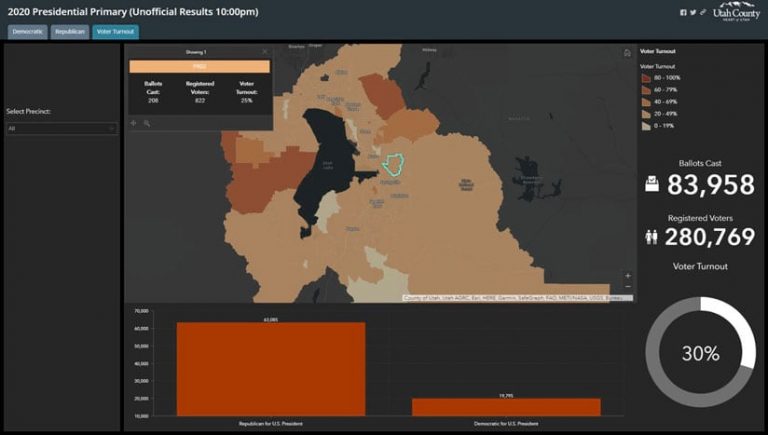
By using ArcGIS, Befus was able to input voter data—voter turnout, political party affiliation, number of total ballots cast, election night results, and other essential information.
Residents can now refer to any recent election, filter out specific voter data, and do their own analysis, thus enabling the public to interact with the voter data for the county like never before. Not only is the election results dashboard useful for displaying historical data, it’s also a vital resource on election night itself.
According to Befus, county staff saved about four hours’ work throughout election night during a recent primary election by updating the county’s public-facing dashboard as results came in.
Once a 50-minute process, ArcGIS takes only 3 minutes to produce an updated count and information on which candidates are winning per geographical area.
“Additionally, the new election night results reporting dashboard is now the envy of the state,” said Utah County clerk/auditor Amelia Powers Gardner.
“It was so successful in our municipal elections that several cities abandoned their own results tools and directed voters to our website. The mapping feature provides a visual display of the votes tabulated. The tool allows voters to zoom in on their specific precinct to see how many voters participated and how the votes were cast.”
As the county updates election results at an unprecedented rate on the dashboard—thereby freeing hours of staff time—the county can allocate more resources to securely collecting ballots leading up to and during election day.
Managing Drop Box Ballot Security
Many jurisdictions across the country allowed mail-in ballots for the November election and tried to do this securely and efficiently.
Because mail-in voting has been the norm in Utah for several years, Utah County has developed a streamlined workflow to efficiently track, dispatch, and collect data from field staff, minimizing any issues stemming from collecting ballots at various locations. Ballot security was a major public concern during this year’s election season.
During a recent primary, Utah County placed 20 ballot drop boxes near strategic locations such as libraries, recreational centers, and city offices. To maintain ballot security, Utah County’s GIS department used ArcGIS QuickCapture, a mobile app that gives the field staff who collect the ballots the ability to capture photos, text, and other data quickly for drop box ballot tracking.
To ensure that every ballot is accounted for, the county equipped each election day mobile worker, or rover, with the ArcGIS QuickCapture app on their smartphone. As each rover arrives to their assigned drop box, they drop a point on a map in QuickCapture, weigh the ballots and enter that information into the application, and provide a time stamp of when the ballots were picked up.
Once the rover returns to the elections department office, staff weighs each bag of ballots to ensure that its weight—and therefore the number of ballots inside—matches the information that the rover typed into the application This way, staff verify that no ballots are lost in transit.
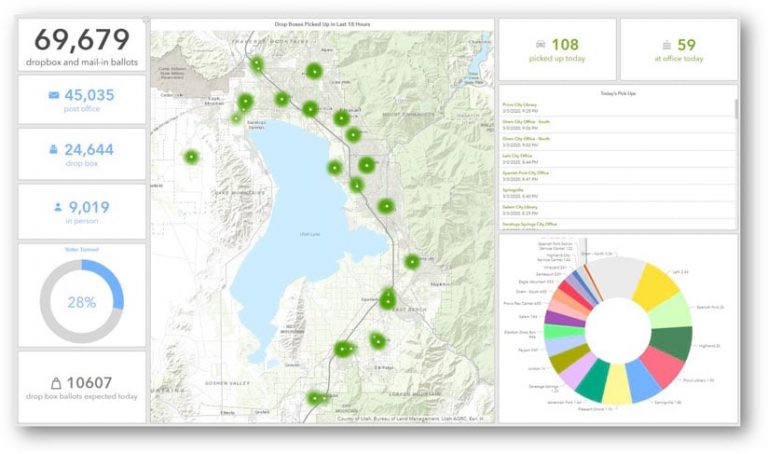
These measures illustrate transparency and accountability to residents because elections staff have the exact time stamp and location of each drop box pickup. If residents contact the elections department to ask if their ballots are secure and safe, the data that the rovers collect enables the department to share that information.
Gardner acknowledges, “In today’s election environment, security at every step of the process is crucial to ensure public trust and confidence in our system—the very system that undergirds democracy itself. . . . The new drop box tracking and mapping feature allows us to anticipate the volume of ballots and ensure that we are staffed appropriately. It also gives us critical security oversight on the movement of returned mail ballots.”

Befus agrees that data accountability is crucial.
“Our elections team now knows what we can do as [a] GIS department, and they know how much we both want to show accountability and help the public by providing good data. Their confidence in GIS has skyrocketed because of the amazing things we have been able to produce to help their day-to-day workflow,” she said.
It is essential for elections departments to work efficiently, offer access to real-time election results, and provide transparency to communities during an election, as voting is one of Americans’ most important constitutional rights. Most jurisdictions faced a steep increase in mail-in voting, a unique process that presented the challenge of securely gathering the ballots — whether they were mailed in, deposited at a drop box, or turned in at a polling location.
ArcGIS streamlines the elections process by capturing drop box location activity as well as collecting and sharing election results more efficiently. You can update your jurisdiction’s election processes by incorporating GIS technology before your next election.