With access to reliable and high-speed internet practically a prerequisite for living and working in a digitally connected world, it’s easy to forget that digital broadband access is distributed unevenly across the United States. Some places, such as the Appalachian region of Ohio, are particularly underserved, in many cases failing to meet the federal definition of high-speed internet.
It isn’t simply a problem for rural areas, either—urban centers can be just as impacted. And with so many remote workers and students in online classes, it’s imperative that places like Ohio enable reliable and affordable access to high-speed internet in every corner of their state.
To address this digital divide, a coalition of local government councils and business leaders known as Connecting Appalachia is employing GIS and demographic analysis to address the lack of broadband access in the region. This coalition turned to Reid Consulting Group, a telecommunications firm based out of Athens, Ohio, to ensure that the state had an accurate picture of Ohio’s broadband situation. Reid in turn brought in Platte River Analytics to assist with the GIS side of things, including data collection and analysis.
Before new data was collected, the Federal Communications Commission (FCC) reported that only 190,000 households in the entire state of Ohio lacked broadband access. However, state leaders suspected the real number was far higher.
Because the FCC collects data solely from service providers at the census block level, there was a high likelihood that the data was skewed. For instance, when a provider identifies a single location with high broadband speeds in a census block, the entire census block is considered to perform at those speeds. Since FCC data is used to determine the level of funding necessary to provide additional broadband services, this method of data collection has the potential to leave multiple households or neighborhoods in the dark.

Gathering the Data
The first tool Platte River and Reid Consulting Group employed when compiling coverage ratings for Ohio was Ookla Speedtest Intelligence, a service that provides location-based reporting of consumer-initiated speed test results.
“Anytime you do a speed test on your computer, it’s almost always through Ookla,” said Andy Bohnhoff, president of Platte River Analytics. “Anytime you do that, Ookla gets that point. They know your [latitude and longitude], and they know your internet speed.”
Reid analyzed 18 months of Speedtest Intelligence data provided by InnovateOhio, an economic development agency headed by Ohio lieutenant governor Jon Husted. This analysis integrated over nine million test results from February 2020 through August 2021—with data such as census demographics, federal broadband deployment reports, and FCC Rural Digital Opportunity Fund eligibility maps—to get a clearer picture of broadband accessibility in the state.
“[Reid] came up with a system to rate every census block from good to bad,” said Bohnhoff. “That allowed us to view it in a spatial environment all the way down to a census block level rather than a ZIP code or a city or county [level]. Going down to the census block level allowed us to get really good detail on what areas of Appalachia [are] underserved.”

After analyzing this data in ArcGIS Pro, Platte River published it in ArcGIS Online, including additional information like fiber-optic line location, transportation routes, demographics, and coverage territories as individual layers.
“We were able to add BroadbandOhio and Connecting Appalachia into our [ArcGIS Online] group,” said Bohnhoff. “We could share data and ideas and trends so easily inside ArcGIS Online. [It] helped steer this project and helped us to work collaboratively in a spatial environment.”
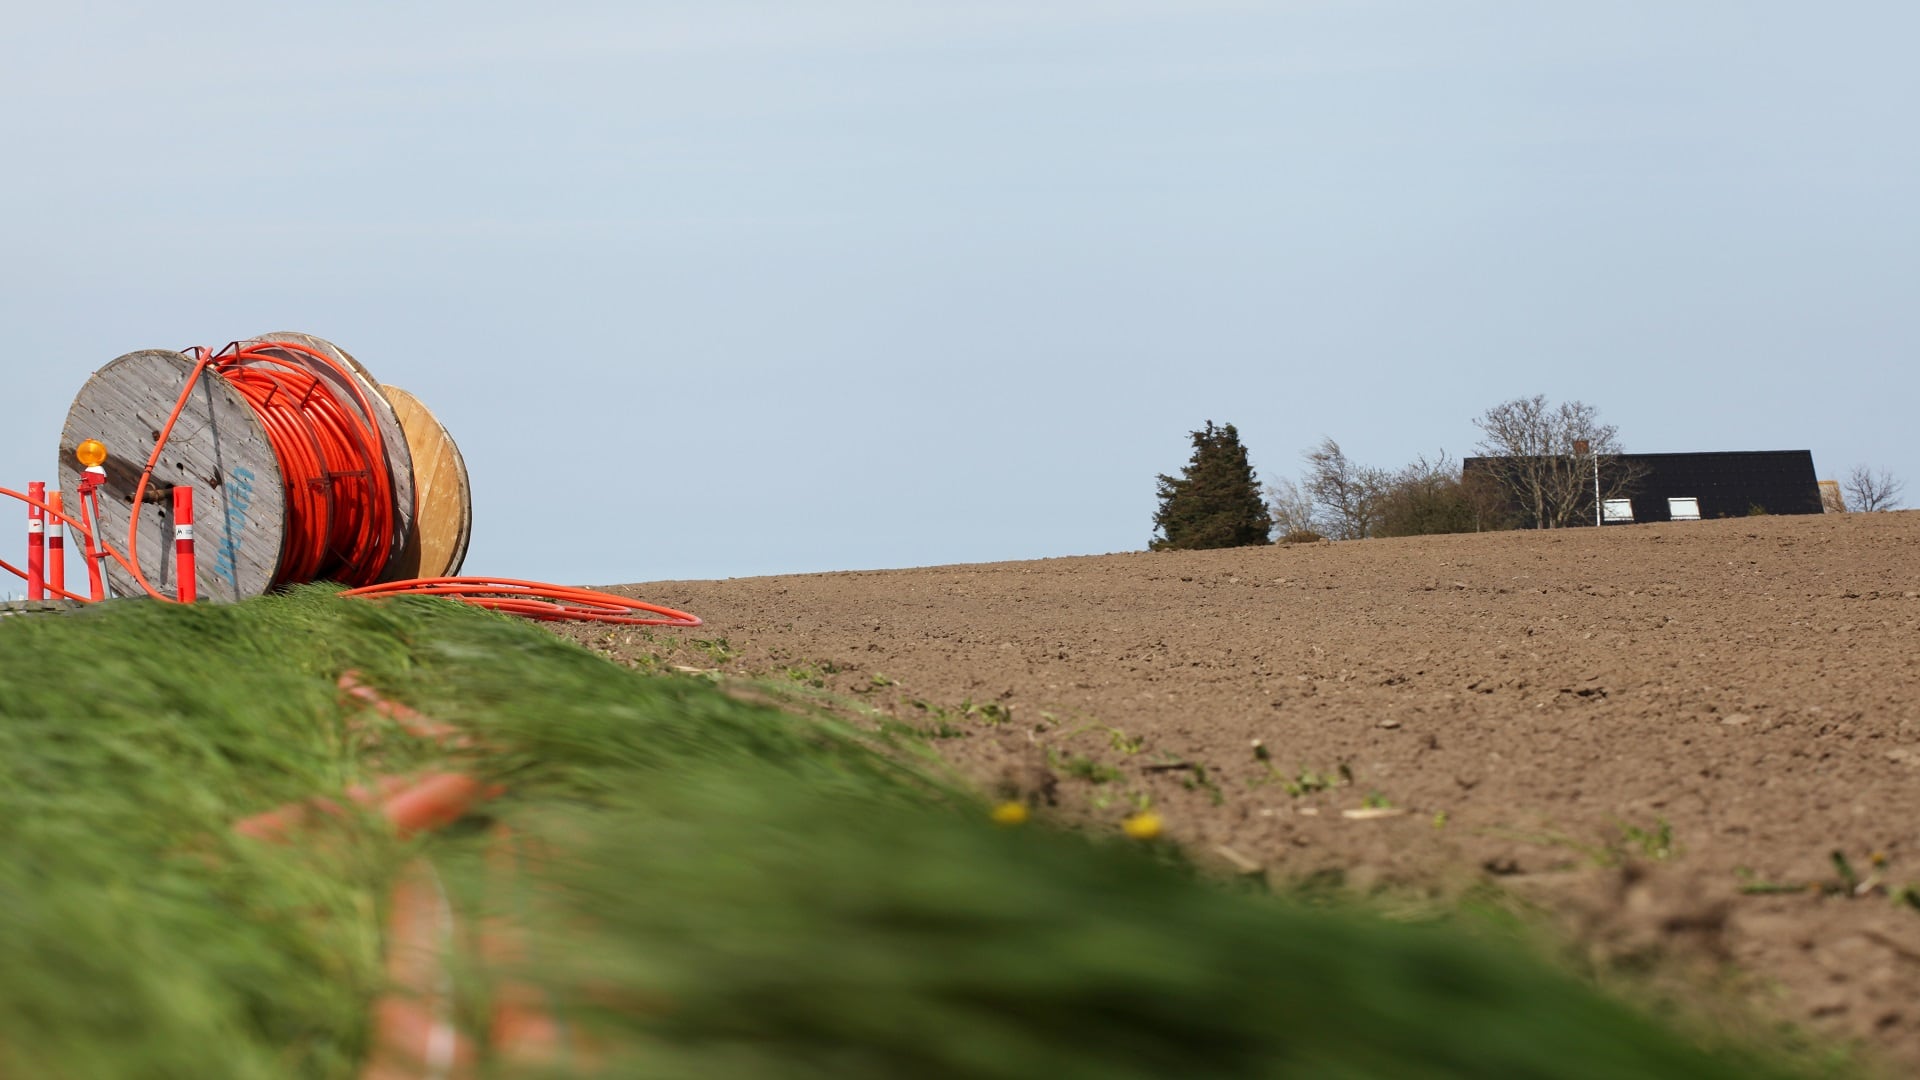
From Field to Fiber
Once results from the analysis were available, it was clear the FCC had severely underestimated the number of Ohio households without access to reliable broadband internet. In reality, nearly 800,000 households demonstrated internet speeds below the FCC minimum of 25/3 megabytes per second (Mbps). In Appalachian Ohio, a whopping 55 percent of populated areas access the internet at speeds less than 10 Mbps for downloads and 1 Mbps for uploads.

The next step was determining how and where broadband fiber-optic cable could be distributed in underserved areas of Appalachian Ohio. “After we determined broadband needs by census block, we were able to give a better assessment of proposed fiber locations,” said Bohnhoff.
The Connecting Appalachia coalition and the State of Ohio will be able to use the data collected and analyzed by Platte River and Reid Consulting Group to bring reliable broadband access to thousands of underserved and unserved communities. In this region and others, state and federal funding can and should be used to advocate for effective data collection, accurate mapping, and efficient resource allocation to establish reliable broadband standards.
Ohio is just one of many states looking to bridge the gap between those who have reliable broadband access and those who don’t. Other agencies are using similar methods to verify broadband speeds and availability—and the more tests completed, the more accurate the data becomes. It’s clear that interactive and dynamic maps are essential tools when bringing broadband access to underserved communities.
“The reason I love bringing GIS into these projects is it paints a picture [of] what needs to be done policy-wise,” said Bohnhoff. “GIS allows you to come to a conclusion faster and paints a better picture [of what] that conclusion should be.”