The Saudi Arabian Oil Company (Saudi Aramco) manages nearly 15,000 miles of hydrocarbon transmission pipelines, bringing oil, natural gas, and other energy supplies to customers and export facilities throughout Saudi Arabia.
Like any network of its size, Saudi Aramco’s pipelines contain a huge number of asset types that are subject to emergencies and abnormal conditions which require immediate action to restore safe operations. But this network also covers varying, often extreme terrain, and needs to be able to withstand harsh environmental conditions, with summer temperatures in the central portion of the country often exceeding 120 degrees Fahrenheit.
Because of the nature of Saudi Aramco’s vast operating area, hundreds of critical assets and equipment continuously check the operating parameters of the pipes and enable remote performing actions. The amount of data that needs to be processed is enormous—every 45 minutes, data is fetched from more than one million data points.
That’s where the Pipelines Asset Reliability Monitoring Application comes in. Built with ArcGIS API for JavaScript (now ArcGIS Maps SDK for JavaScript), and the Utility and Pipeline Data Model (UPDM) in ArcGIS Enterprise—and integrated with a Plant Information (PI) system to extract real-time data from the field about the condition of network assets—the dashboard app is designed to help monitor the health, availability, and reliability of Saudi Aramco’s assets and equipment.
Module by Module
Due to the complex and extensive analysis involved in monitoring the entire network, the Pipelines Asset Reliability Monitoring App is divided into four modules, each covering a different type of asset. The four asset types monitored by the app are Remote Terminal Units (RTU), Class-1 valves, Surge Relief Valves (SRV), and Pressure Reducing Stations (PRS). Each module generates key performance indicators (KPIs) and performs trend analysis about its respective assets and equipment.
Each of these modules, with the exception of PRS module, are designed to display two customized data tabs within the app—a management data tab and a detail data tab.
The management tab provides an overall summary of KPIs and analysis of assets and equipment, and is primarily intended to communicate information about the network’s health to directors or managers. The detail tab—or “Asset Status”—provides more in-depth analysis for engineers and subject matter experts. It also enables engineers to easily spot any asset malfunctions as they are illustrated on the map with colorful symbology that reflects the current operating status of each asset.
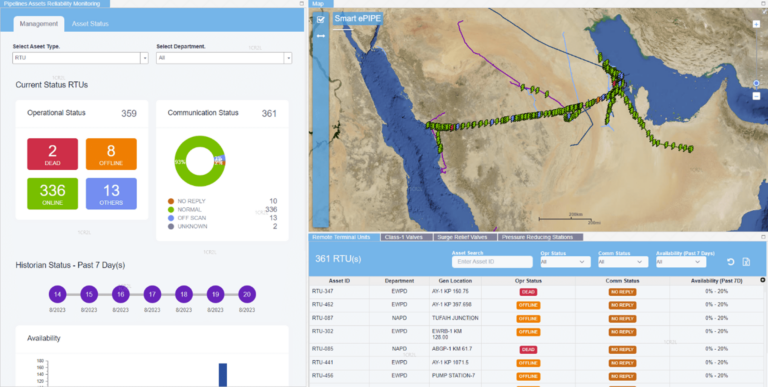
The first module covers RTU assets in the pipeline network, which are designed to monitor and control other field devices. The module displays the current health status of RTUs and provides a seven-day historical trend analysis. The detail tab can focus on a single RTU and display trend analysis data to help develop predictive maintenance plans, enabling repairs before any failures occur. The map shows all RTU locations and can display nine different statuses for ease of visual review.
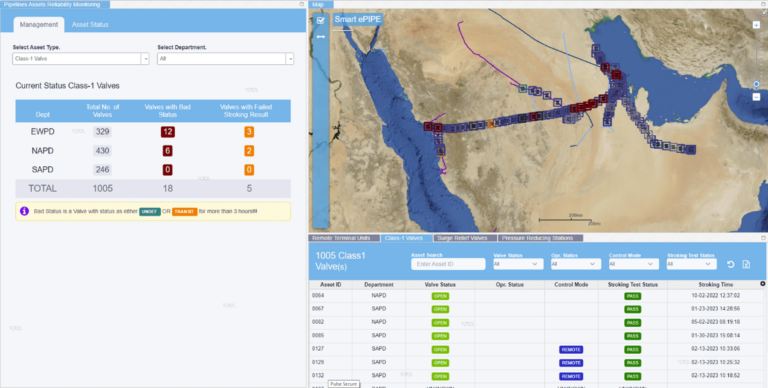
Like the RTU module, the Class-1 valve module also displays KPIs and health status, but due to the importance of Class-1 valves in the day-to-day operations of the network, as well as in emergency situations, this module relies on a variety of data. For instance, the app shows the current status of each valve as either open or closed. It also displays a trend analysis for the last three hours, and any malfunction is reported immediately to be addressed by inspection and maintenance crews. Moreover, the module provides KPIs for the last 12 months of valve stroking—a test of a valve’s full range of motion—to ensure each valve is operating smoothly.
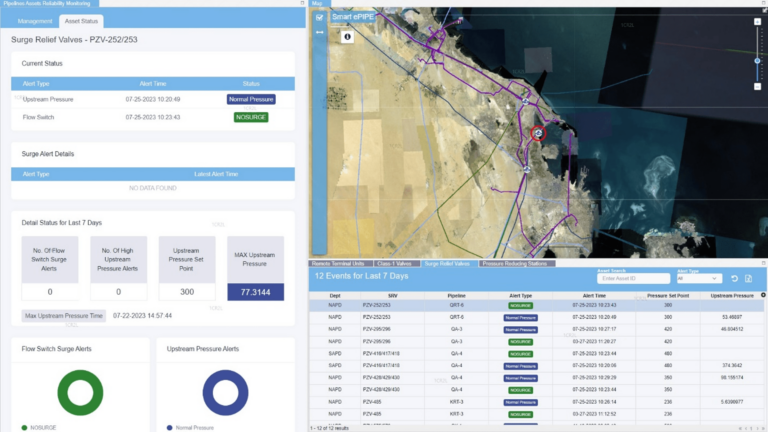
The third module monitors the health of SRVs. This critical equipment is used to ensure safe levels of operating pressure for pipelines and that these pressures are maintained below set points. This module performs analysis of field PI data to report upstream pressure compared to the designated set point pressure. Any pressure exceeding the set point is reported immediately, as is the time of the surge event and the subsequent reliability of each SRV. As with the first two modules, the status of each asset is represented with eye-catching symbology, and trend analysis monitors the health of the SRVs over the last seven days.
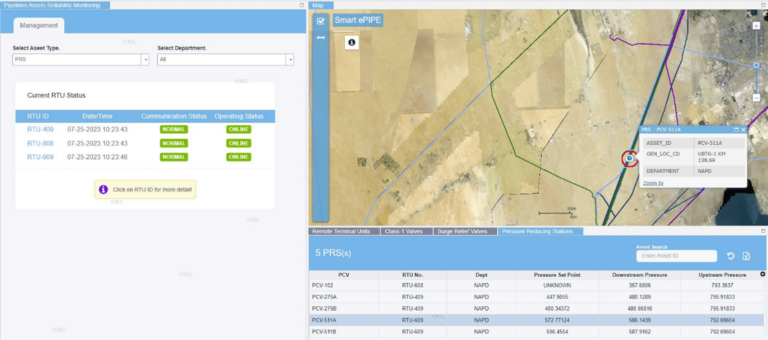
The fourth and final module covers PRSs, and is designed to display real-time field data about upstream pressure, set point pressure, and downstream pressure, as well as the location of each PRS and the health of the RTUs that provide this data.
The Benefits of Pipeline Monitoring
Closely observing this kind of data throughout Saudi Aramco’s pipeline network allows the organization to have a full picture of the current operating conditions and overall health of over 1300 different assets installed across a massive geographical area. This means that the whole network can be more easily maintained, and when emergencies do occur, the response is rapid and precise.
The many KPIs and trend analyses that the Pipelines Asset Reliability Monitoring App tailors to both managerial and engineer levels support effective decision-making, optimize maintenance and inspections, and assist in predictive maintenance activities. Ultimately, the greatest success of this app has been in ensuring the safety of pipeline operations and maintaining an uninterrupted flow of energy supplies across the territory of Saudi Arabia.
About the authors

Thamer Tarabzouni

Saeed Aljabri

Iftikhar Ahmed

Hussain Al-Thawadi