When responding to a natural disaster like an earthquake, whether it has caused devastation or minor damage, often more data is needed than just the quake’s location and magnitude. What neighborhoods were affected? Who lives there? Analysis tools in ArcGIS Online can help provide more information about the magnitude of these events.
In this tip, you will determine the total population that is within the area of an earthquake of a specific shake intensity. The analysis will be performed using Map Viewer analysis tools with ArcGIS Living Atlas of the World content. Note that an ArcGIS Online account is required to use analysis tools to complete the tip.
Make a Map of Recent Earthquakes
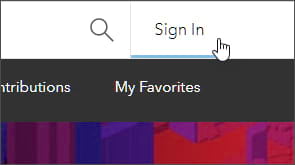
Step 1: Go to the ArcGIS Living Atlas of the World website and sign in using your ArcGIS account.
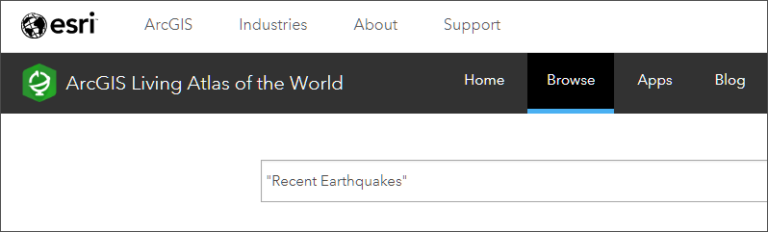
Step 2: Open the Browse tab and run a search for “recent earthquakes”.
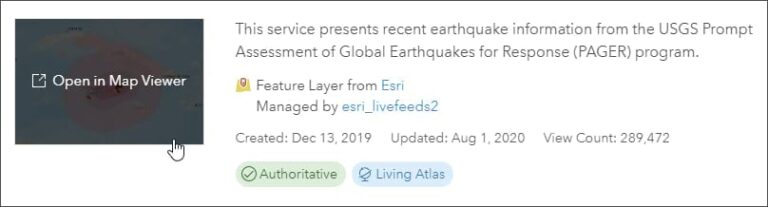
Step 3: Locate the Recent Earthquakes feature layer and click the thumbnail image or title to open the item details.
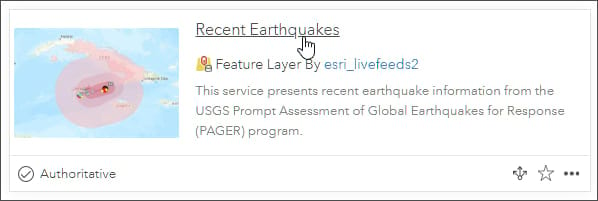
From the Recent Earthquakes item details, we learn that quakes are displayed by magnitude along with impact information. Events are updated as frequently as every five minutes and are available for up to 30 days, except for events of magnitude less than 3.0 (retained for three days) and events of magnitude less than 4.5 (retained for seven days). Labeled quakes are those with a PAGER alert, which is a measure of the scope and impact of the event.
Step 4: Open the layer in Map Viewer. Save the map.
Locate a Quake Event for Analysis
Step 5: Explore the map to find an earthquake of interest to analyze. Earthquakes are symbolized as circles based on magnitude.
Because this is a live feed, the earthquake events shown in the images for this tip will not match what you will see when working with this tip. However, by following the steps in this tip, you can look at the earthquakes shown and determine the total population within the area of an earthquake with a specific shake intensity.
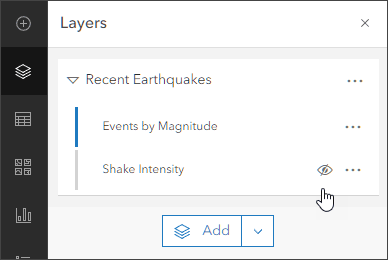
As you explore the map, click the feature associated with each quake to learn more about it. Note that Recent Earthquakes is a group layer containing Events by Magnitude and Shake Intensity. To focus on one of the layers, expand the Recent Earthquakes layer (in the upper left) by clicking the angle bracket (>) symbol to the left of Recent Earthquakes, then using the visibility controls (the eye symbol) to hide layer pop-ups.
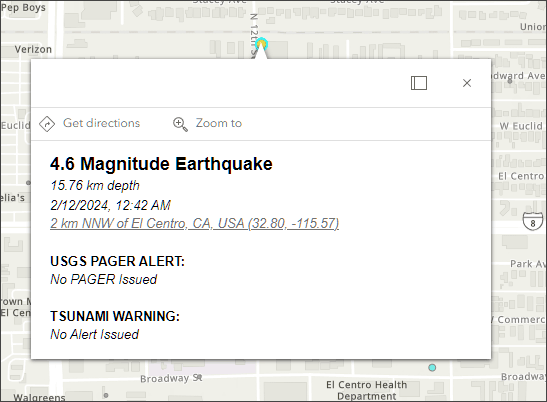
The Events by Magnitude layer pop-up displays the magnitude, depth, date, time, PAGER alert status, and tsunami warning information. It also includes a link to the US Geological Survey event details.
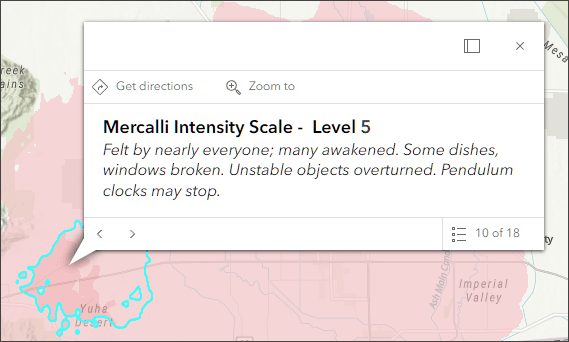
The Shake Intensity layer pop-up displays the Modified Mercalli Intensity Scale value and a description of what was felt and any expected damage.
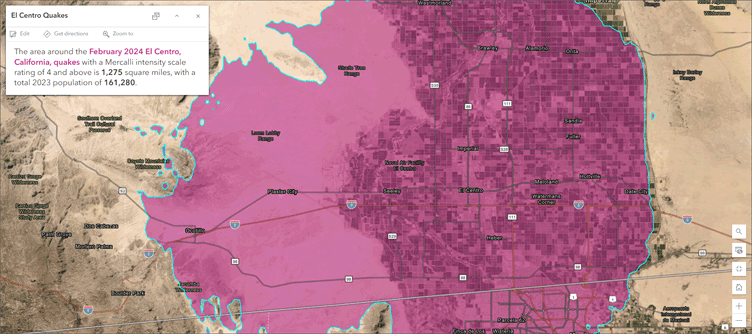
At the time of writing this tip, a quake near El Centro, California, was recent enough to be chosen for analysis.
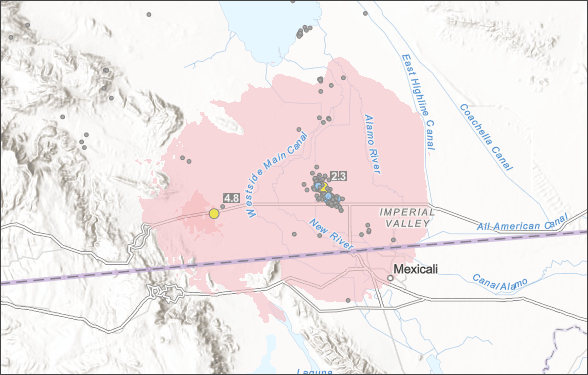
Now you will apply a filter to the Shake Intensity layer to show areas with an intensity of 4 or greater, eliminating lower intensities where the quake is less likely to have been felt or caused damage.
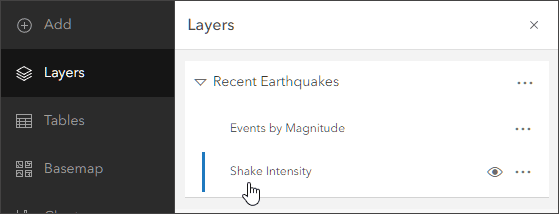
Step 6: From the Layers pane, open the Recent Earthquakes group layer and select Shake Intensity.
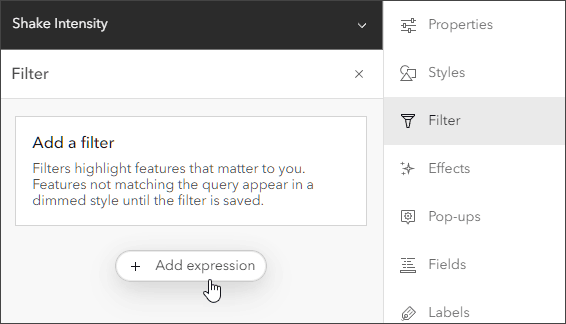
Step 7: From the Settings (light) toolbar to the right of the map, open the filter pane and click Add expression.
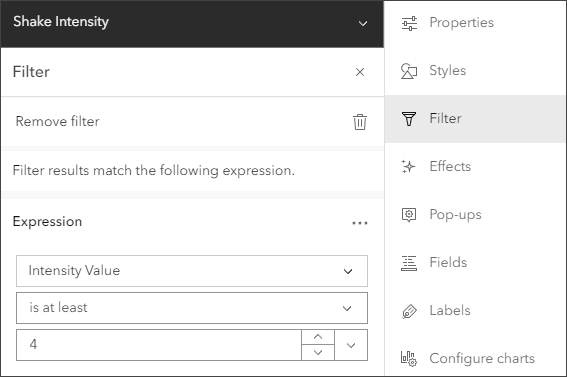
Step 8: Filter expressions use the general form of <Field_name> <Operator> <Value>. Use the drop-down menus to create the desired filter. For this tip, choose Intensity Value, is at least, and 4. When finished, save the filter.
Dissolve the Boundaries
Since there may be overlapping or disconnected polygons matching the expression, dissolve the layer to create a single, multi-part polygon for further analysis.
Make sure you are zoomed to the area around quakes of interest so that only your selected quake or quakes are displayed. You will use the display extent to limit the analysis to this area; otherwise the analysis will be applied across the entire extent of the Recent Earthquakes layer.
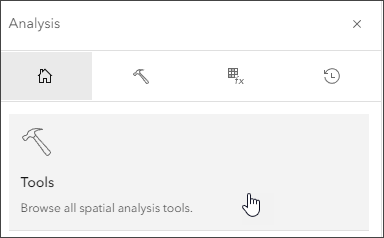
Step 9: From the Settings (light) toolbar, click Analysis.
Step 10: In the Analysis pane, click Tools.
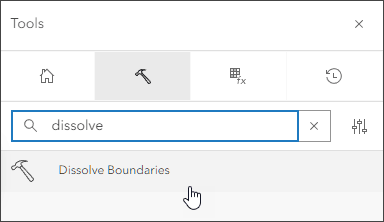
Step 11: Locate the Dissolve Boundaries tool. You can find it in the Manage data section, or you can use the search box.
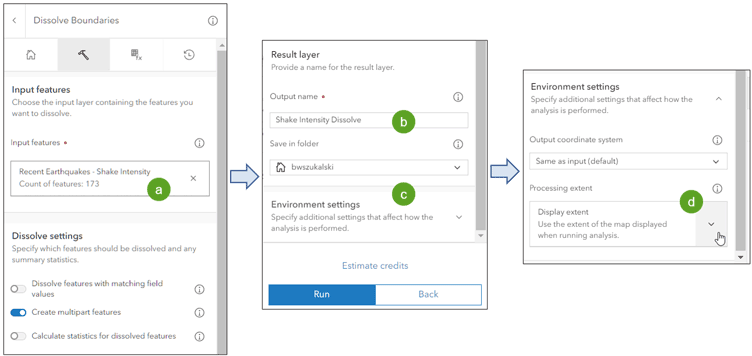
Step 12: Enter the following Dissolve Boundaries tool inputs and settings in the tool pane:
(a) Under Input features, select the Shake Intensity map layer.
(b) Under Result layer, name the layer Shake Intensity Dissolve.
(c) Open Environment settings.
(d) Under Processing extent, choose Display extent. This will limit the analysis to the area you have zoomed to.
(e) – Click Run when finished.
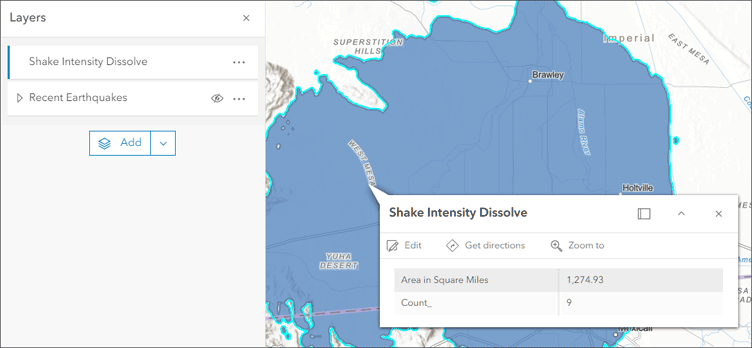
You will see a notification that the analysis has been submitted. You can view the current status in the tool history. When the analysis is complete, the layer Shake Intensity Dissolve will be added to your layers pane.
Step 13: Hide visibility on the Recent Earthquakes group layer and click the Shake Intensity Dissolve layer feature (the area of the earthquake on the map) to view its pop-up.
Now that you have a dissolved multi-part polygon, you can enrich the layer to learn more about the population or other enrichment variables in the earthquake area.
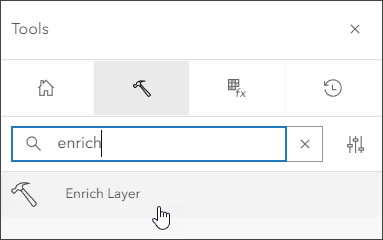
Step 14: Locate the Enrich Layer tool in the Analysis pane on the Settings (light) toolbar. You can find it in the Enrich data section, or you can use the search box.
Enter the following Enrich Layer tool inputs and settings in the tool pane:
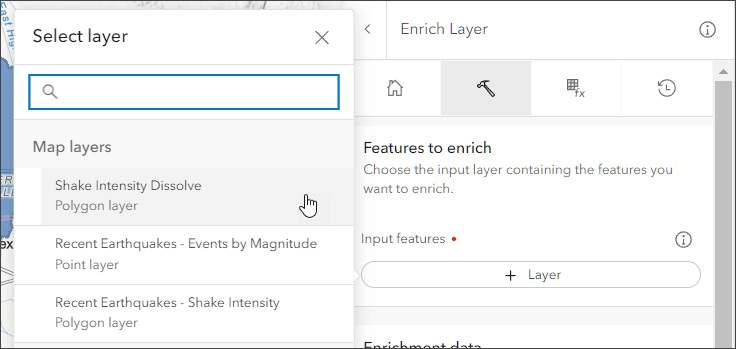
Step 15: Select the Shake Intensity Dissolve layer from the list.
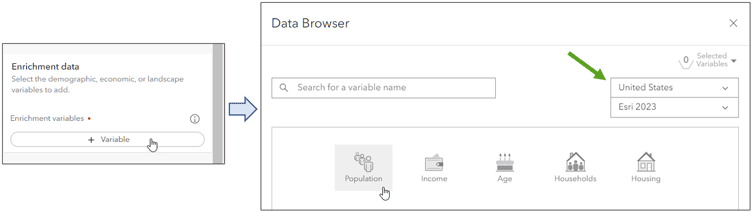
Step 16: Click + Variable. Ensure that the correct location and the most recent data year are selected from the Data Browser drop-down menus, then select Population in the Data Browser pane.
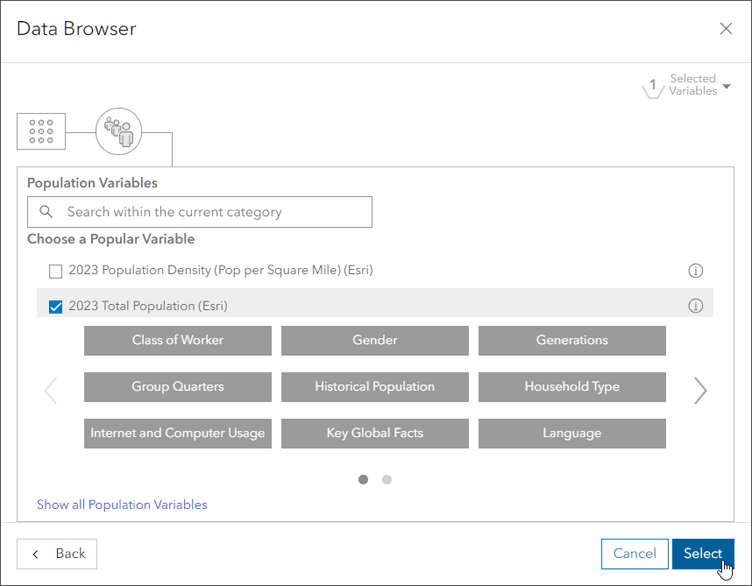
Step 17: Check the box for 2023 Total Population (Esri). Click Select when finished.
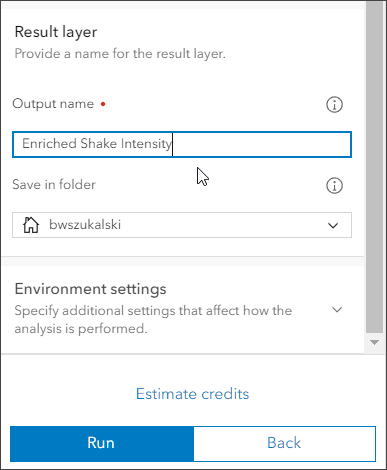
Step 18: Enter a name for the output analysis layer. Here, name it Enriched Shake Intensity. Then click Run.
You will see a notification that the analysis has been submitted. You can view the current status in the tool history. When completed, this layer will be added to your layers pane.
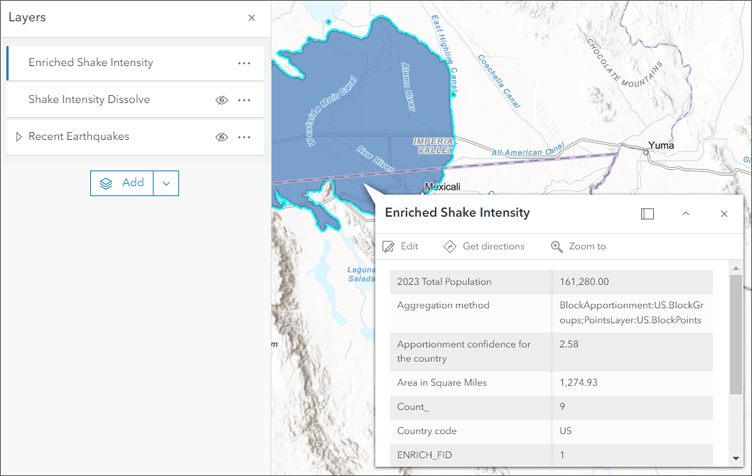
Step 19: Hide visibility on the Recent Earthquakes group layer and Shake Intensity Dissolve layer, then click the enriched layer features to view its pop-up.
The pop-up shows the total population for the earthquake intensity area. If you have selected other variables, they will also be included in the layer attributes.
To complete your map, you can remove unneeded layers, choose different basemaps, apply effects and blending, and configure the layer pop-up. The map can then be used in a variety of configurable apps and app builders as well as in stories or even custom JavaScript applications.
More Information
For more information, check out the following: