
For many prospective homebuyers, the time it would take to commute to and from work is important to consider when they are thinking about where to buy a new house. Knowing how long the commute will take at different times of day can help them to choose from homes that offer shorter commutes.
Esri ArcGIS Online can help to create drive-time areas based on fixed speeds or traffic conditions using a specific departure time. Doing this type of analysis can help prospective homebuyers narrow their choice of cities or neighborhoods.
Using the analysis tools and a traffic service provided in ArcGIS Online, you can create a map of the areas from a point or points that can be reached within a specified drive time or driving distance. You can also include the time of day to see how traffic volumes in an area change over time. For drive-time areas based on a given start time, data provided by a traffic service reflects the traffic conditions at that time.For example, you could create a map of the drive time to work based on typical traffic at 8:00 a.m. to see which neighborhoods offer homes within a specific commute time if you left at that time.
This tip shows you how to create a map based on driving time using ArcGIS Online.
In this example, a person is thinking of buying a house in Redlands, California, and will commute to work at the University of California in Riverside. Creating multiple drive-time areas from the university will show homes that have a range of commute times. The analysis will specify 8:00 a.m. on Monday, a typical time and day to commute to work.
To perform analysis on ArcGIS Online, you need access to an ArcGIS Online organizational account. A public account will not work.
Step One: Find the location from which you want to create drive-time areas.
- From a web browser, go to ArcGIS Online.
- Sign in to your ArcGIS Online for Organizations account. You also may sign up for a 30-day free trial.
- Open the map. Add the CSV file for the homes to the map. You can download it here [ZIP]
, then click and drag it onto the map from the folder in which you saved it. - Note that the address locator will be used with the Address and City fields in the CSV file to find the point locations. Click ADD LAYER.
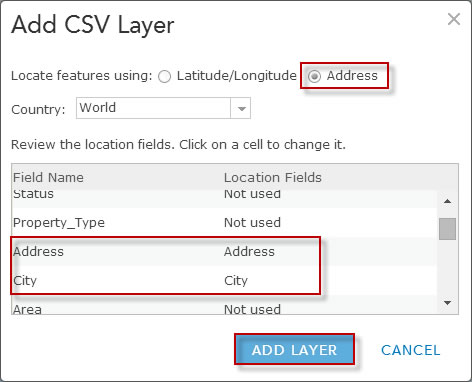
The address locator is used to find the locations of the points in the CSV file. The map will zoom to the location of the points.
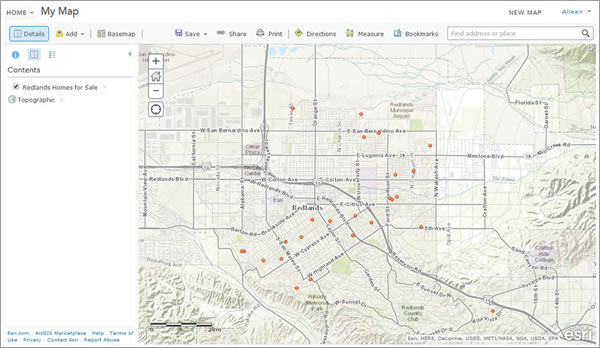
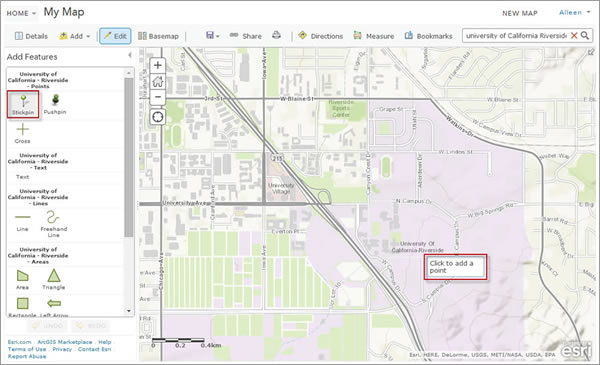
After adding points from a CSV file to a map, the display automatically zooms to the extent of the data. - Find the work location by typing “University of California Riverside” in the search box at the upper right of the screen. The drive time will be measured from this point along roads to create the areas. The map will zoom to the location you specified.
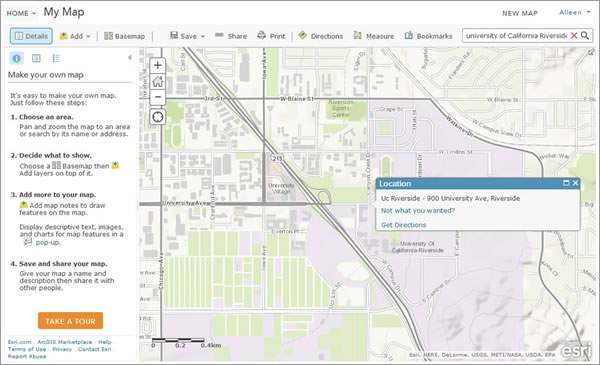
Use the search box to quickly and easily find where you want to start your drive-time search. - Click the X at the upper right of the Location box to close it.
- Click Add at the upper left of the screen, then click Map Notes.
- Name the location so that you can easily identify it and then click CREATE.
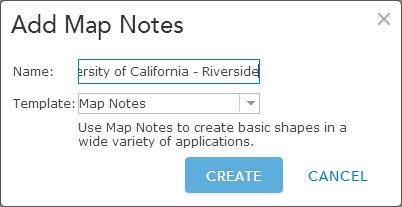
The name you enter will be displayed in the map legend. - Click a stickpin, pushpin, or other symbol in the Add Features box at the left and then click the location on the map.
The symbol you choose will be added to the map. Name the location in the title and, if you want, add a description, then click CLOSE. The symbol will be added to the map.
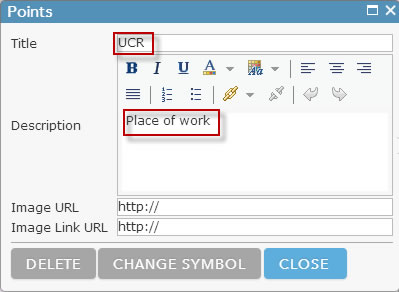
The information you add here will appear in the pop-up window when you click the map symbol. - Click the arrow to the right of Add Features to close the Add Features dialog box.
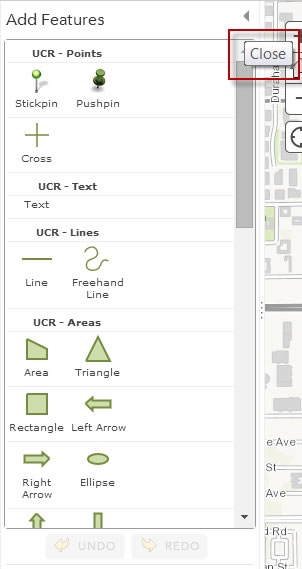
Clicking the arrow at the upper right of the Add Features dialog box will close it. - Click the Content button to see the new map notes layer in the table of contents.
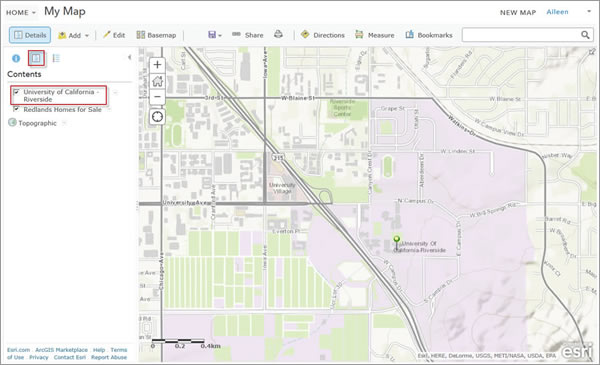
When you close the Add Features dialog box, you will see the new map notes layer in the table of contents.
Step Two: Perform the drive-time analysis.
You can create the drive-time areas based on traffic at the time of day you specify.
- Click the arrow to the right of the map notes layer in Contents.
- Click Perform Analysis and then click Points.
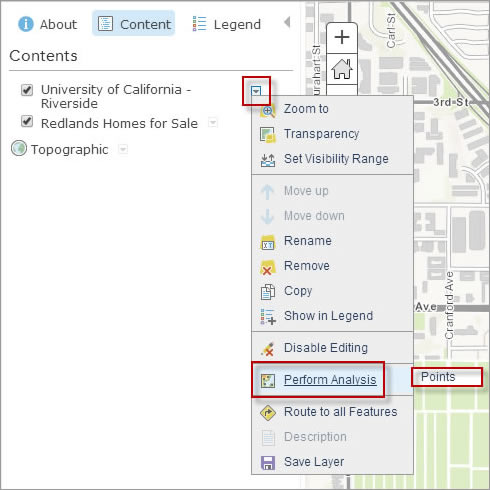
Click Perform Analysis to access the various spatial analysis capabilities. - Click Use Proximity and then click Create Drive-Time Areas.
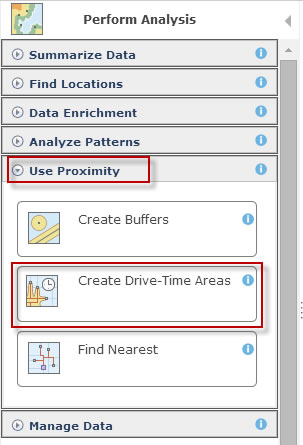
Drive-time analysis is one of the proximity analysis tools in ArcGIS Online. - To create areas that are measured using driving time rather than driving distance, click the option to measure drive time, then input 10, 15, 20, 25, and 30 minutes. Separate these values with spaces when you input them.
- You can also use traffic information to refine the drive-time areas based on current traffic speeds referenced from sensors and predicted traffic speeds that are calculated by referencing live traffic feeds, historical speeds, and current events such as weather. Traffic speeds are predicted 12 hours into the future, so you can move the slider to set the departure time ahead by up to 12 hours. Click the Use traffic option and use traffic data based on conditions typical for a Monday at 8:00 a.m. Change the resultant layer name to Commute at 8:00 a.m. Uncheck the option to use the current map extent and then click RUN ANALYSIS.
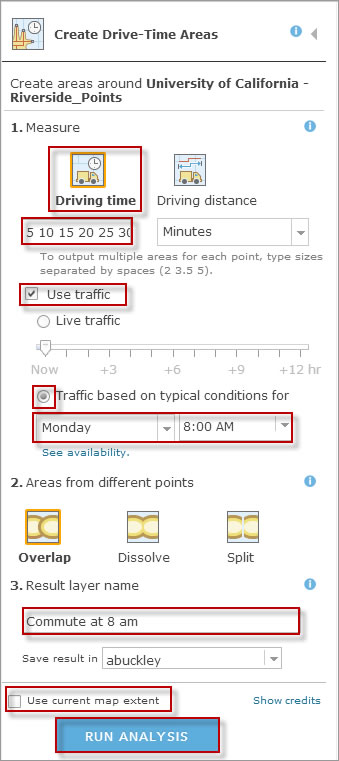
Create drive-time areas based on driving time or driving distance and use traffic information based on live traffic feeds, historical speeds, and current weather for a day and time you specify.
Step Three: Display and assess the results.
Finally, verify that the information makes sense, then determine whether you need to run additional analyses.
- Zoom out to see the full extent of the drive-time areas. Click the arrow to the right of the drive-time areas layer in the contents and click Move down so that it is easier to see the points.

- Click the name of the new layer in Contents to see what the colors on the map mean.
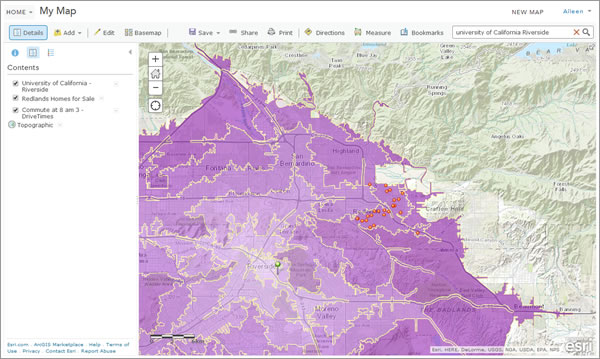
The drive-time areas are shown as filled polygons. Darker polygons have longer drive times. - Click a drive-time area to see the pop-up window with the drive-time information.

Take a few minutes to explore the map and the pop-up windows. If you want, run the analysis again using a different time, then compare the maps to find the optimal commute time.
Read this document to learn more about drive-time analysis with ArcGIS Online.
