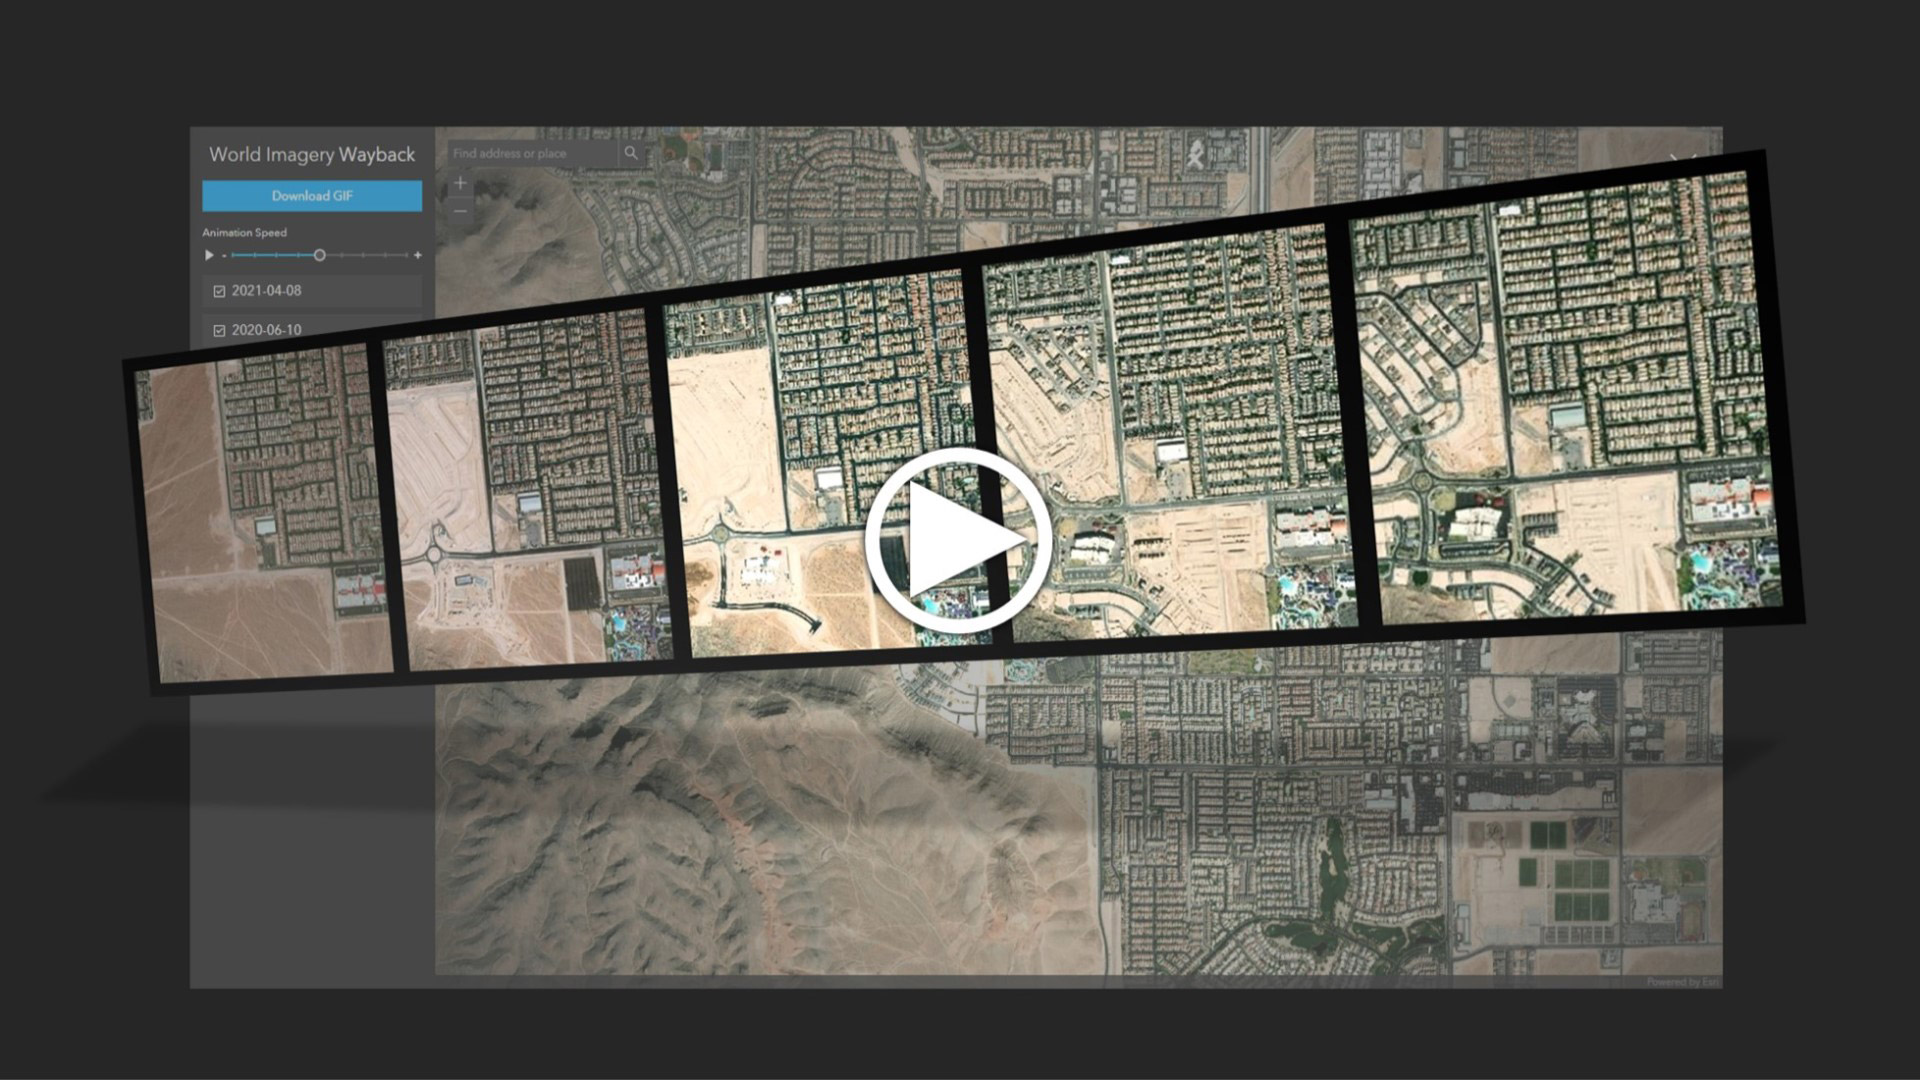
Create and Share Visualizations of Change Over Time Using Animate Mode in the World Imagery Wayback App
The World Imagery Wayback app provides access to a digital archive of previous versions of the World Imagery basemap, currently containing more than 120 different versions of the basemap with imagery captured since 2014. A recent update to the app gives you the ability to create animations of your images of interest so you can visualize change over time and share those visualizations with others. Creating and sharing these animations is useful in many ways, including giving colleagues within organizations the ability to see land use and environmental changes around the world.
Portions of Southeast Asia have undergone tremendous change due to land reclamation, often to the detriment of ocean life, according to this article Cities from the Sea: the true cost of reclaimed land, which was published in The Guardian newspaper. The animation you create in this tip illustrates that change over several time periods.
Step 1: Open the World Imagery Wayback app. Note: You can also find the app on the Apps tab of the ArcGIS Living Atlas website, in the Wayback Imagery group, or by searching ArcGIS Online.
The app automatically opens centered on an area to the southwest of Las Vegas, Nevada, a location with some marked changes over the past few years. For this tip, however, you will explore Singapore.
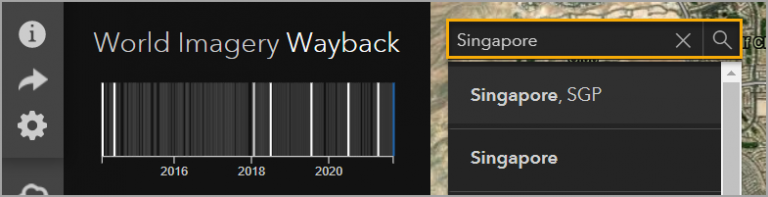
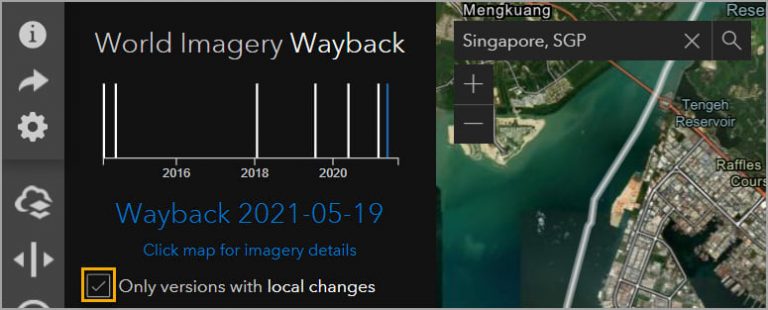
Step 2: Type Singapore into the search box and select Singapore, SGP.
Step 3: Pan and zoom to the port area south of the Jurong Industrial Estate. The area to zoom to is drawn with a yellow box in the image below.
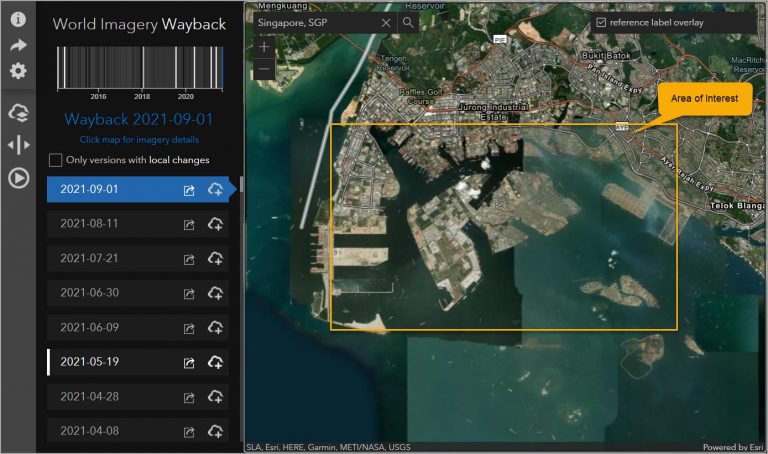
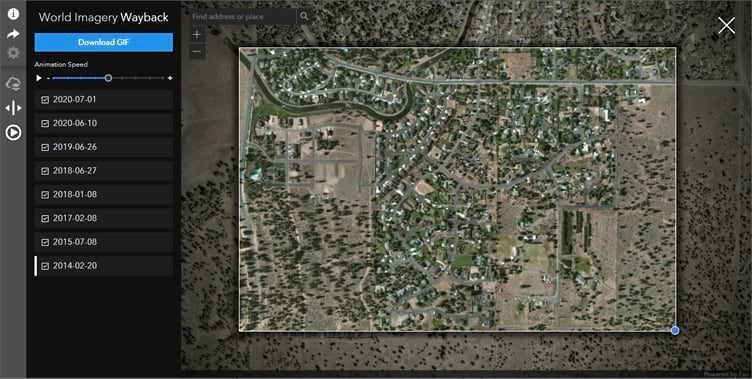
Step 4: Vintages of the World Imagery basemap that are available are shown as layers in the app’s left pane. The layers with local changes are highlighted in white in the list and in the timeline at the top of the pane. (A “local change” occurs when the satellite image in the basemap is updated for the area in the view window.)
Check the box to the left of Only versions with local changes.
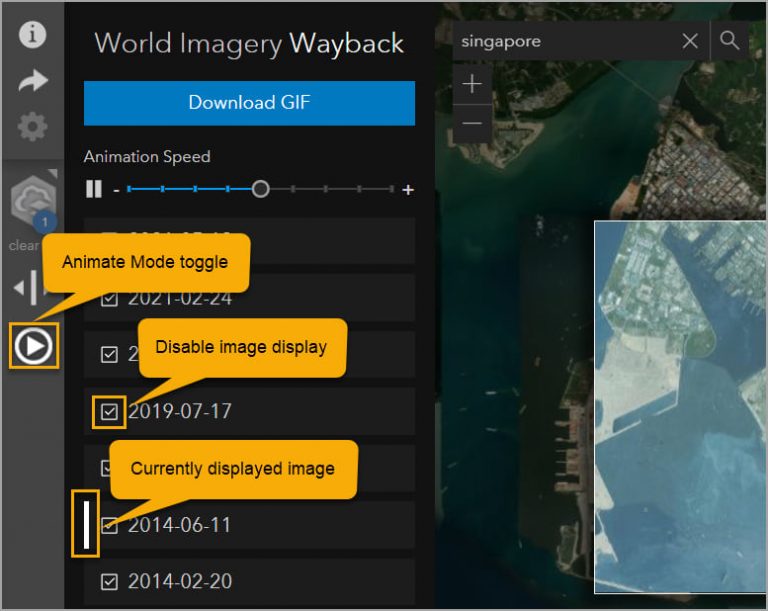
Step 5: Hover over any layer to see a preview of the image on the map. As you preview the images, you can determine if there are any you want to remove from the animation. For this animation, you will use all the images.
Step 6: To view the animation, click the toggle to turn on Animate Mode. The pane changes to show a list of the layers in the animation. This list is automatically populated with the images that have local changes. A check box to the left of a layer can be used to toggle the visibility of that layer in the animation. Once the animation starts, the currently displayed image is indicated by a white bar to the left of the image name.
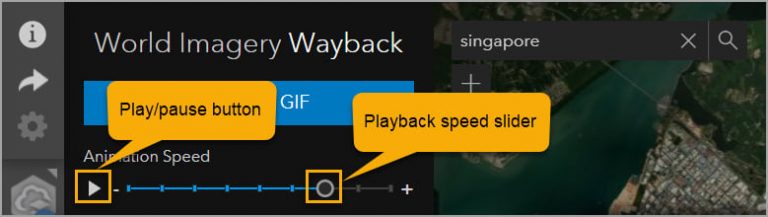
Step 7: In animate mode, you can use the animation controls at the top of the pane to play/pause the animation and control the speed of the playback. Pause the animation and move the slider to the right to speed up the playback.
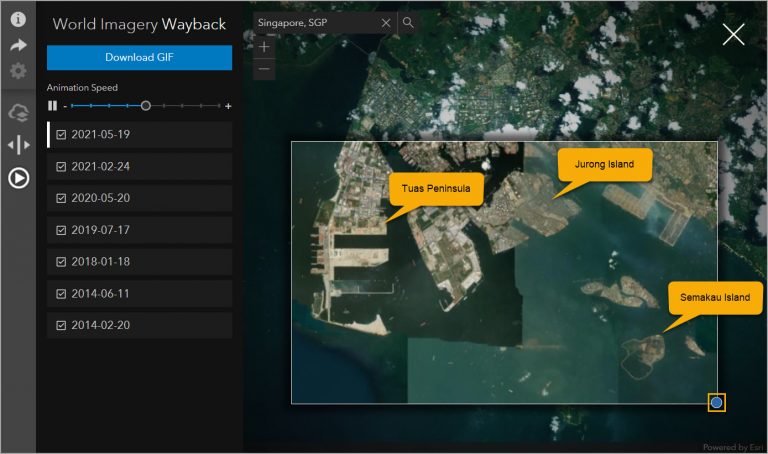
Step 8: To refine the size and position of the animation window, pause the animation, ensure that you are zoomed out so that all of the frame can be seen, and then click inside the frame and move it to the left so that the Tuas peninsula to the west is included in the window. Click the blue dot at the bottom right of the window to resize it to include all of Semakau Island.
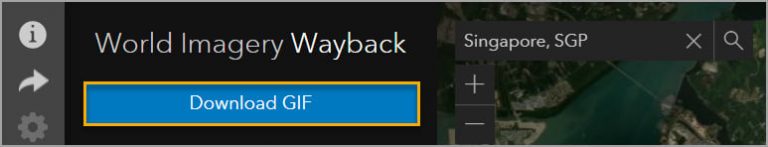
Step 9 – Click Download GIF to save a copy of the animation as an animated GIF to the Downloads folder on your computer.
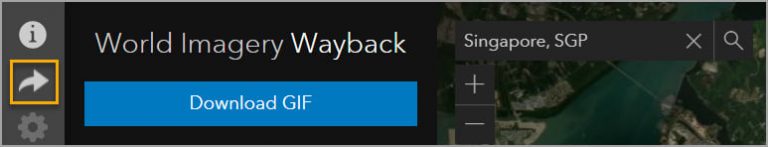
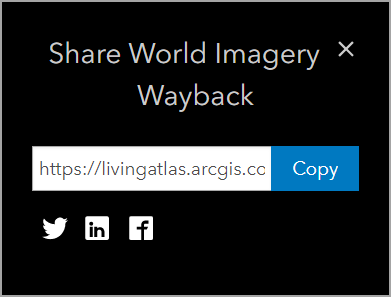
Step 10: Click the Share button to copy the URL so you can share it with others.
There are also options to share the animation via social media (Twitter, LinkedIn, or Facebook).
Using the steps in this tip, you can visualize change over time as a series of layers from the Imagery Basemap, and you can easily share that visualization with others. Take some time to create your own animations or check out these animations by Bernie Szukalski:
To learn more, see Playback Your Wayback in ArcGIS Blog and additional Wayback blog posts.