According to the National Center for Education Statistics (NCES), more than 12 million US students enrolled in K–12 schools in the 2022–2023 academic year lacked adequate internet access. Roughly 37 percent of rural students are without sufficient internet connectivity needed to do schoolwork compared with 21 percent of those living in urban areas and 25 percent in the suburbs. Students without consistent internet access not only demonstrate weaker digital skills but also have lower grade point averages and homework completion rates.
One of the organizations trying to tackle this classic example of a pervasive digital divide is Fireline Science, which develops education technology products using artificial intelligence (AI) and analytics. The company is using GIS tools to implement Tuneni—an offline computer operating system and learning application designed for K–12 students—for schools in areas where students may not always have reliable internet connectivity. The data visualization and analysis capabilities in ArcGIS Pro, for instance, have been crucial in assessing where the program will provide the most benefit to the most students.
According to Collin Sellman, CEO and chief product officer of Fireline Science, this division between students with and without consistent home internet access is known in the education sector as the “homework gap.”
“The Federal Communications Commission’s (FCC) Broadband DataTask Force reports that 70 percent of the teachers in the United States regularly assign homework that requires access to the internet,” said Sellman, who is also on the faculty of the Arizona State University Information Systems department. “Students on the wrong side of the gap cannot complete their homework, review feedback from their teachers, prepare for class, or participate in any virtual learning. They are ultimately being left behind their internet-connected peers.”
This gap was only exacerbated by the COVID-19 pandemic and related school lockdowns. Postpandemic academic recovery programs often rely on a combination of online and offline solutions for tutoring and after-school programs. While the pandemic facilitated advances in distance learning, the digital divide is now affecting the ability of a substantial number of schools to recover from related learning losses.
“GIS data, analysis, and visualization have helped us clearly understand the homework gap,” said Sellman. “[We can now] work with schools on specific and effective solutions.”
Finding the Digital Divide
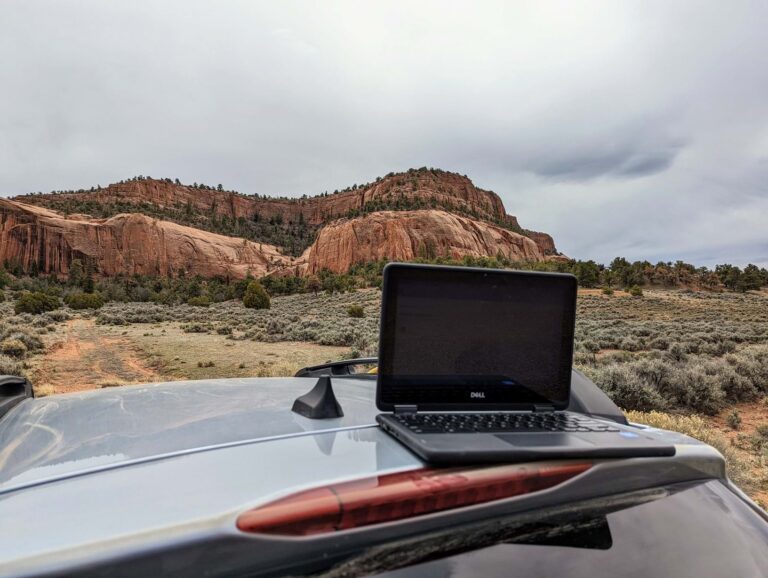
Sellman was motivated to create Tuneni because of the challenges his father faced as an elementary school principal on the Navajo Nation in northern New Mexico. When the COVID-19 pandemic forced many schools to transition to a virtual learning model, more than 75 percent of his students lacked home internet and were effectively excluded from any virtual learning solutions.
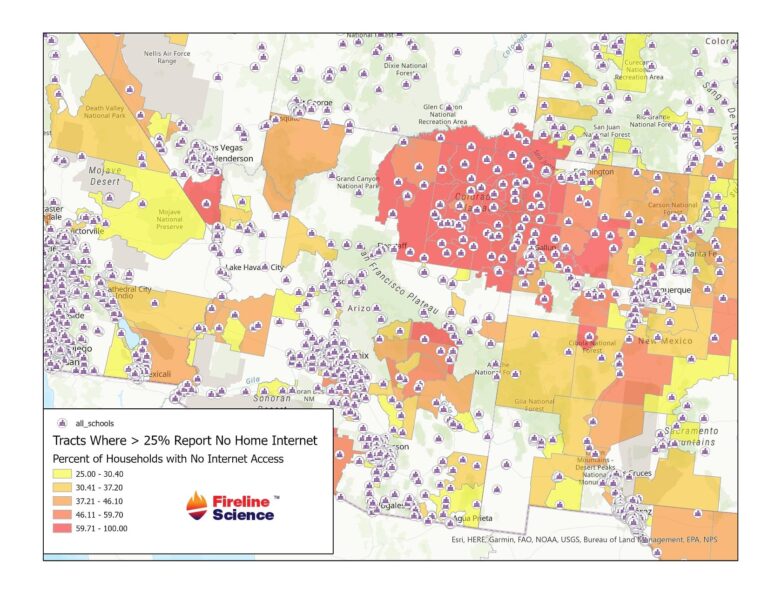
“Our research shows that more than 17,000 schools in the United States are located in census tracks where 25 percent or more of households report not having home internet access,” noted Sellman.
Therefore, Tuneni had to be able to work for sustained periods without internet connectivity. It also needed to be intelligent and easy to use and have the capability to sync with the cloud to share information between teachers and students.
The current version of the operating system runs on any modern, web-enabled device. The lessons generated support current digital formats including PDFs, videos, and interactive Jupyter Notebooks. Teachers can create digital homework assignments via Tuneni’s multisubmission workflow, which enables them to help students progress through their assignments using a variety of digital support tools. Interactions include teacher and student video responses, as well as interactive annotations, including context-specific video annotations.
“Tuneni uses an innovative cloud-edge architecture that allows the centralized management of students and learning activities even when students are working offline at home,” says Sellman. “The system manages all the complexity of a distributed system including versioning and conflict resolution. It also includes an innovative edge intelligence engine, which uses AI and machine learning to enable prompts and recommendations to assist students even when they are not connected to the internet.”
But implementing a program like this requires knowing where and how to target it so that it will have the most impact—and for that, Fireline Science needed a lot of geospatial data.
“Our project started without any intention to use GIS,” said Sellman. “The initial analysis used FCC data that provided the overall percentages of rural and Native American students who don’t have home internet access. The percentages were concerning but not specific enough to be actionable or to have detailed conversations with school leaders.”
So, Sellman turned to more sources of data, including US school data from NCES; US community internet access by census tract data from the American Community Survey; social vulnerability by census tract data from the CDC/ATSDR Social Vulnerability Index; GIS data for Native American communities from the University of California, Berkeley; and internet speed test data from Ookla.
Because some of the datasets were extremely large, Python was used for preprocessing, before the datasets were imported into ArcGIS Pro for further processing and analysis.
“We performed an analysis of the 500 census tracts in the US with the lowest rate of internet access using survey and empirical test data. This was only possible with a spatial join of census and school location data, which required Python preprocessing,” said Sellman.
A Geographic Approach to Remote Learning
After processing this demographic data in ArcGIS Pro, Sellman noted, Tuneni can more accurately target the areas and schools where the program will do the most good.
“When we shifted to the geographic approach, we could answer questions such as, Where is the [connectivity] problem the most pressing? What are the causes of the problem? Which schools are in areas with the worst internet connectivity?”
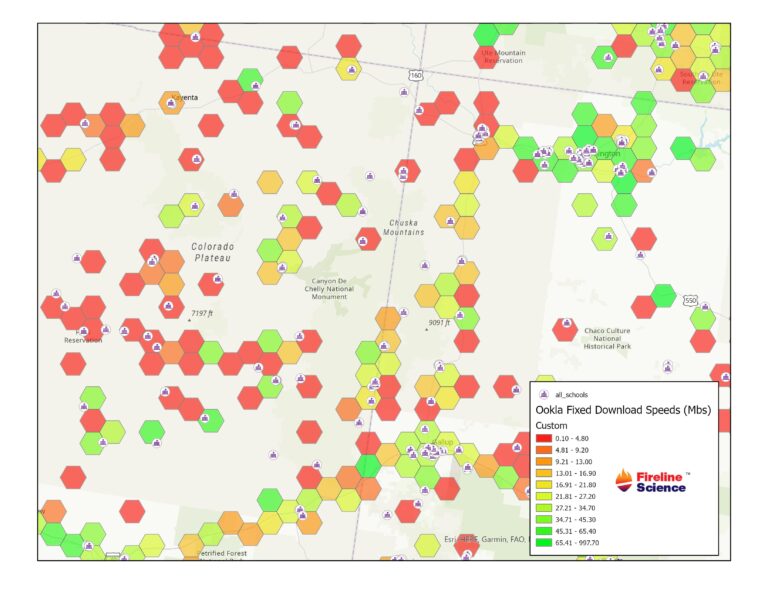
Sellman was also able to use the data to determine how internet connectivity varies across regions, as well as analyze the differences between fixed and mobile internet access.
By leaning on geospatial data in the implementation of Tuneni, Fireline Science has been able to prioritize students that have been left behind by the digital divide, whether as a result of the pandemic or as a consequence of already pervasive connectivity inequities.
“Once we started collecting, analyzing, and visualizing data using ArcGIS Pro, our understanding and engagement with schools dramatically improved,” said Sellman. “We now go into every meeting with data-rich maps of the issues for specific schools.”
About the author