A core mission of California community colleges is to provide access to education programs and workforce opportunities for every learner—foster youths, adult learners seeking general education diplomas, employees who are gaining career skills, veterans, high schoolers in dual-enrollment programs, and low-income first-generation students. But these students often lack accessible, reliable data on the economic outcomes of their educational choices.
California Community Colleges’ Vision 2030 aims to increase the number of students earning a living wage, recognizing the roadblocks they face in planning for their education and their futures. To address these challenges, the Coast Community College District (CCCD) in Orange County is using geospatial tools to give students a road map to career success. The goal is both to provide students with the critical information and education needed to secure sufficient entry-level salaries and to foster economic advancement in fields ranging from transportation and biotechnology to retail, hospitality, and tourism.

Expanding GIS Tools to Better Serve Students
Community colleges have significant limitations on how they collect labor market information and share it with students. Often, data on high-priority business sectors, locations of businesses hiring, salary information, and required skills are months or years old and presented only in tables and spreadsheets. Studies show that students’ lack of access to reliable and credible data about expected labor market outcomes, not surprisingly, minimizes how they weigh this information in making programmatic decisions.
“Navigating labor market information can be daunting for job seekers. We thought, ‘There has to be another way,’” said Stephanie Feger, program director for career education and workforce development at Coast Community College District. “That’s when we decided to map the information spatially.”
Information on those spreadsheets wasn’t easily accessible, understandable, or updatable. So CCCD deployed TalentED, created using ArcGIS StoryMaps. TalentED turns geographic data into interactive content to help students visualize labor market information for different occupations, including who is hiring, where they are located, salary information, and skills required. As CCCD expanded partnerships with community-based organizations and workforce development agencies, staff also wanted to include more real-time data to identify living-wage careers and career pathways. One way to achieve that was by implementing a more comprehensive, GIS-based tool that would appeal to a larger audience.
CCCD had initially launched the TalentED resource to promote career exploration but sought to empower students with more specific, individualized resources. Assisted by Esri partner Blue Raster, CCCD staff leveraged ArcGIS to develop the OC Works web app, a resource for college administrators, students, and guidance counselors. The app’s goal is to provide a shared understanding of labor market information so that students and those entering the workforce can make better-informed decisions about education paths and outcomes.

Hosted on a site built using ArcGIS Hub, the app includes individual tools created using ArcGIS Experience Builder and ArcGIS Online. The app’s tool for exploring employers is based on findings from surveys conducted with ArcGIS Survey123. Additionally, real-time data was incorporated using a Lightcast API.
“The use of real-time data through the Lightcast API is essential for providing transparency to job seekers and career counselors,” noted Dr. C. J. Bishop, CCCD senior research analyst and one of the developers of OC Works. “Often, industry data is outdated or too generalized, leading to confusion about specific skills, education requirements, and salary ranges. The Lightcast API delivers daily [employment data] updates, ensuring that users receive the most accurate and detailed information available.
“We’re able to look at labor market data based off key partnerships in the region . . . to show not only key industries that we know will help people move up economically, but also what skills are needed,” he added.
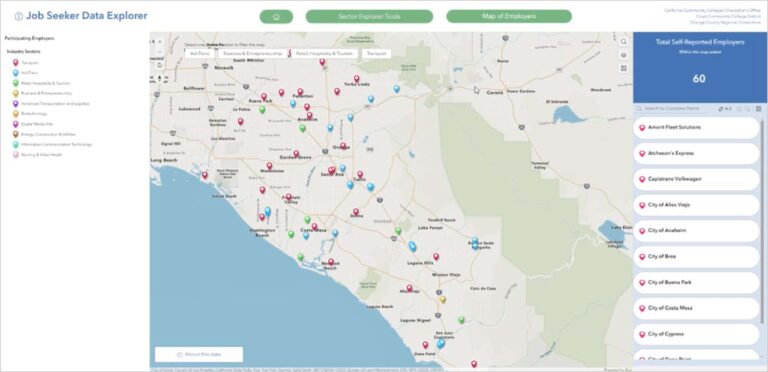
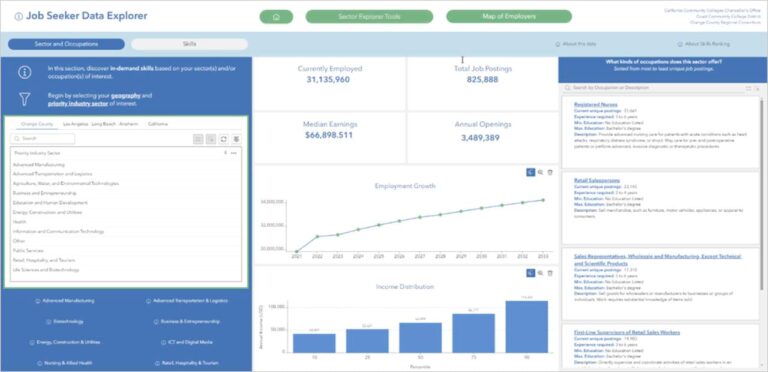
With OC Works, community college program directors are able to view up-to-date information on skills and certifications to understand how their program offerings match workforce needs. Students can explore interactive maps and data visualizations that display job locations; public transportation information; and median salaries, skills, and educational requirements for each job sector.

“Having geospatial tools where we can identify potential partners in this work is really a game changer for understanding populations in our region, where we can do outreach, and where we can build partnerships,” said Feger.
Additionally, guidance counselors at K–12 schools can access online maps and workforce data from different employment sectors to help younger students with college and career exploration. Throughout California, community college districts see the value OC Works has brought to their own regions and recognize the potential to increase collaboration with workforce development partners. The app’s developers have also incorporated a regional version of OC Works at job centers for those seeking employment or skills to improve their earnings and outcomes.
Launching the Workforce of Tomorrow
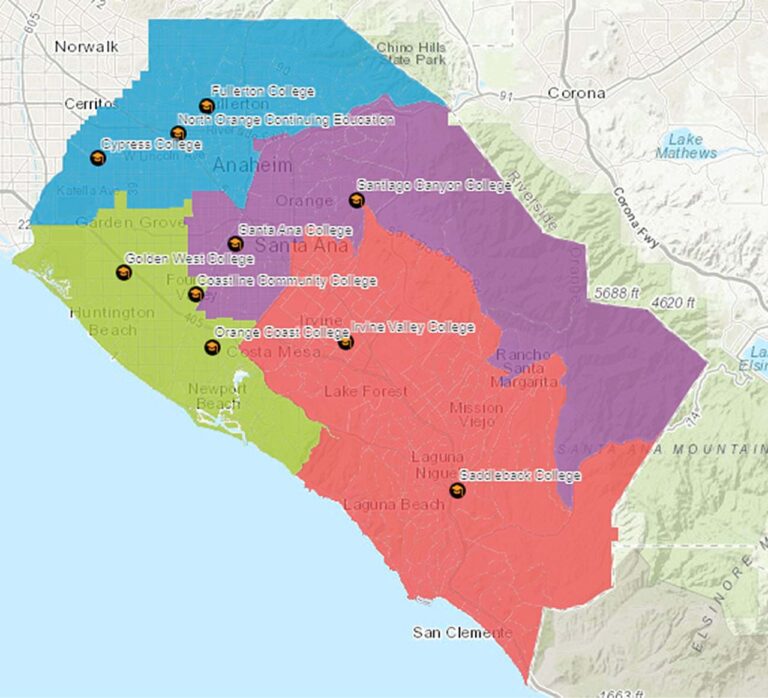
To help identify shared solutions to challenges such as college enrollment, equity, and employment, CCCD is now leading a regional consortium that includes the four community college districts as well as college administrators and district offices to educate institutional researchers on accessing Esri software. Working with Dr. Cecilia Rios-Aguilar from University of California, Los Angeles, CCCD is exploring ways to use Esri’s Social Equity Analysis solution for mapping areas where gaps exist in education attainment and earnings so that colleges can develop targeted outreach strategies.
Information from consortium partners has led to CCCD working closely with adult schools to understand where gaps exist in high school education for people seeking a general education diploma (GED) and more. “This has given us a good opportunity to think collectively about the high-priority sectors with living-wage jobs . . . and target areas of where students are and what [specific] populations need,” said Feger.
Since CCCD staff have been working with other colleges, they have seen a difference in how community colleges approach administrative and academic goals. “They’re all empowered to make individual maps that are helping their colleges and districts,” said Bishop.
Feger and Bishop are continuing to refine their work and hope it inspires other educational institutions and institutional researchers to work with GIS. As Bishop notes, “The work demonstrates the value added of researchers being able to better understand key metrics of enrollment, equity, success, and upward economic mobility in new and more accessible ways that inform colleges and their partners in the region.”

