If you want to give your maps depth and dimension, try using a hillshade effect in them. Hillshades enhance the three-dimensional appearance of the terrain by using patterns of light and shadow to create a 3D representation of the surface that makes it easier to identify landscape features. To create this effect, you can use digital elevation model (DEM) data—a type of raster data that contains an elevation value for each cell. (See figure 1.)

With ArcGIS Pro, you simply apply the hillshade effect to your DEM data rather than create a new layer. This can save storage space, especially if either the map extent or DEM dataset is large. In addition, with ArcGIS Pro, you can use the stunning multidirectional hillshade option, which simulates diffuse illumination by combining light from sources in multiple directions. This is more dramatic than a traditional hillshade that shows light from a single light source in the northwest.
Applying a hillshade effect in ArcGIS Pro is quick, easy, and efficient because ArcGIS Pro uses a raster function instead of the Hillshade geoprocessing tool. Raster functions are operations applied on the fly and directly to the pixels of imagery and raster datasets displayed so only pixels that are visible on the screen are processed. A raster function can be applied to all types of rasters, and the output will be a virtual raster layer. This shortens processing time and saves you the trouble of creating and storing additional data.
In ArcGIS Pro, raster functions are accessed from the Analysis tab. To use a raster function to apply a hillshade effect, follow these simple steps:
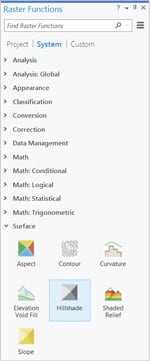
1.Open the Raster Functions pane.
2.Expand the Surface functions and select the Hillshade option (or search for Hillshade in the Raster Functions pane).
3. Set Raster to your DEM dataset.
4. Set Hillshade Type to Traditional or Multidirectional, as desired.
5. Set Scaling to None if you are making a map at a single map scale (such as a printed map), or select Adjusted if you are making a multiscale map (such as a web map). You’ll also want to select Adjusted scaling if you are making a hillshade of a large map extent, since no scaling would result in little terrain variation at small map scales.
6. Set Z Factor to a higher number to exaggerate the height variation in the terrain, or use it to convert the elevation units to the x,y linear units if they happen to be different (see Applying a z-factor to learn more about this second reason).
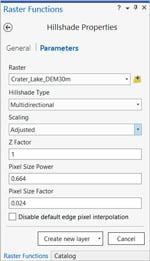
7. Click the Create new layer button at the bottom of the Raster Functions pane to create a new layer in the current map. Note that this is only a new display of the processed data—it is not a new raster dataset.
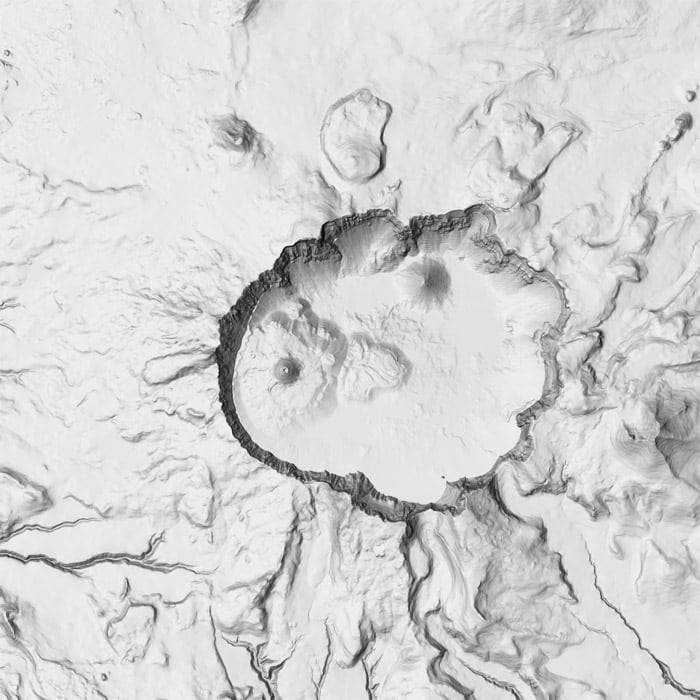
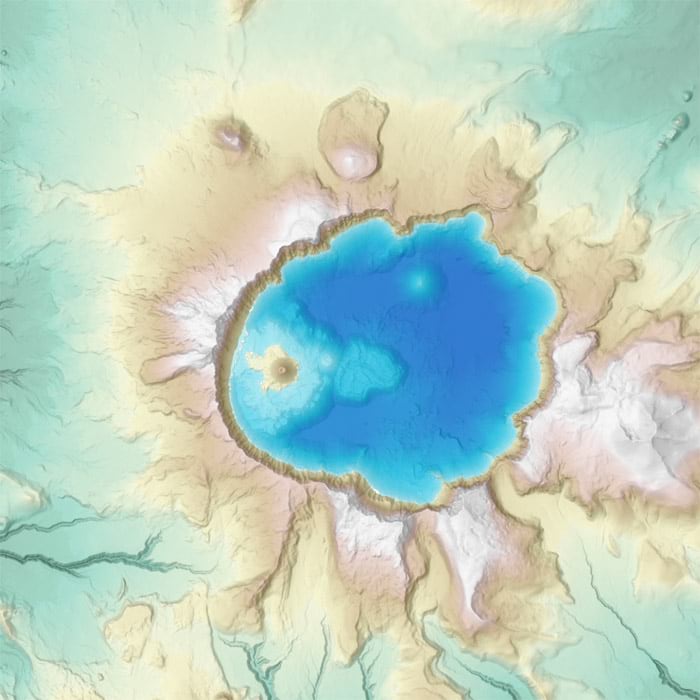
The figures below show how the traditional hillshade compares to the multidirectional hillshade for the Crater Lake dataset.

For Crater Lake, the beautiful texture of the multidirectional hillshade is even more pronounced when higher-resolution data is used. Figure 4 shows the results when 1-meter lidar data was used instead of the 30-meter data displayed in the previous examples.
 resolution data.")
Not only does the multidirectional hillshade reveal more variation in the terrain, thus allowing you to find unique landform features, it also results in a 3D surface with a lighter overall tone. This is preferable when you plan to display other data, such as land use or a hypsometric tint (a DEM symbolized so that elevation values are displayed with varying colors, such as green for valleys, browns for midslope elevations, and white for mountaintops), transparently over the hillshade surface.
The hillshade effect is quick and easy to create in ArcGIS Pro, and it produces visually stunning results. Try it out yourself, and be sure to experiment with the multidirectional hillshade option.
To learn more about the hillshade and other raster functions, read these online help topics: Hillshade functionand Raster functions. To learn more about the multidirectional hillshade, read the blog post “Introducing Esri’s Next Generation Hillshade.”
Crater Lake data source: Robinson, J. E., 2012, “High-Resolution Digital Elevation Dataset for Crater Lake National Park and Vicinity, Oregon, Based on LiDAR Survey of August–September 2010 and Bathymetric Survey of July 2000”: US Geological Survey Data Series 716. (Available at https://pubs.usgs.gov/ds/716/.)
About the author