The United States Geological Survey (USGS), with help from Esri, has created an app that lets you view an extensive collection of USGS topographic maps in one central location. The USGS Historical Topographic Map Explorer makes it easier to explore and enjoy the library of more than 178,000 historical maps, dating back to 1882, in a web application that organizes the maps by space, time, and map scale.
Using the USGS Historical Topographic Map Explorer is easy—just follow the numbered steps in the pane at the left. The choices you make will update the map view at the right. Here’s how to get the most out of the app:

Step one. Find the area you want to explore.
- First, specify the area you want to explore. Type a place-name, address, or ZIP Code in the pane at the left or click a point on the map. When typing a place-name, you can choose from the list of suggested locations.

- After searching for a location, click on the map view to see the historical maps for that location.
Step two. Use the timeline to select the maps.
- The timeline that appears at the bottom of the app shows you the names of the maps that are available and when they were published. The maps timeline is color coded to represent the range of available map scales.

- At the left of the timeline, you have the option to turn map scales on or off. Click a scale value to turn the viewing off for all the maps that display at that scale. Click the scale again to turn the viewing back on.
- Zoom in and out on the timeline using the mouse wheel so you can more easily see the years for which maps are available.

- Pause the pointer over a map in the timeline to see its extent on the main map. A shaded area with a dashed outline will appear in the main map to show you where the map will appear when it is added to the view.

- Click on the map to add it as a layer on the main map. The map will appear in the pane at the left.

- The selected maps might not cover the full extent of the main map. Click a point outside the map extent to see the selection of maps for that area. Often, you can select a map of the same scale and year for that area on the display.
Step three. Compare the maps.
- Use the slide bars to change the transparency of the maps. You can also drag the maps to change the order of display.
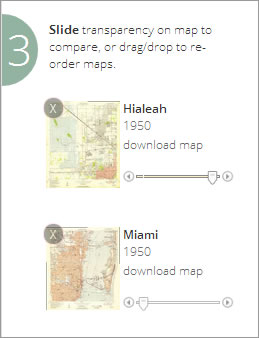
Setting the order and changing the transparency of the maps helps you to compare changes between maps. For example, placing the 1:24,000-scale 1950 map of Miami, Florida, above the 1994 map and then making it transparent allows you to see the development of Dodge Island.


- You can pan the map or zoom in and out using the controls at the upper left. You can also zoom in by holding down the Shift key while drawing a box around the area you want to explore.
- Click download map if you want to download a PDF version of the map.
- To remove a map from the display, click the X at the upper left of the map’s thumbnail.
Here are some examples of places with historical maps that tell interesting stories of the past.
The first is Mount Saint Helens in Washington State. The area around Mount Saint Helens changed dramatically after erupting on May 18, 1980. It was the deadliest eruption in United States history and the costliest. Prior to the eruption, Mount Saint Helens had a conical dome, which is indicated by the circular pattern of contour lines on the 1958 1:24,000-scale map. Note that the summit was 9,677 feet high. At that time, the dome was largely covered by glaciers.

The 1983 1:24,000-scale map showed the mountain after the eruption. Volcanic activity had been building for weeks, causing a bulge on the northern flank of the mountain. On May 18, 1980, a magnitude 5.1 earthquake triggered a series of volcanic blasts that caused the bulge to fail, producing the largest debris avalanche in recorded history and devastating the area to the north. The extent of the mountain’s glaciers, shown outlined in blue on the map, had decreased dramatically.

On the 1998 1:24,000-scale map, you can see that the summit was 7,152 feet high, a decrease of over 2,500 feet since 1958. The map below also shows that the rim of the crater is steeper than in 1958, as evidenced by the more closely spaced contour lines. It also shows additional decrease in the extent of the glaciers. What it does not show, however, is Crater Glacier, which is located inside the dome in the flatter area between the steep rim and the lava dome. The volume of ice in this glacier, which has accumulated since 1980, is about the same as the total for all pre-1980 glaciers combined.

The next example shows the interesting history of Coronado, an island across the bay from San Diego, California.
The 1904 1:62,000-scale map of San Diego shows the resort town of Coronado, founded in 1885. It also shows the Hotel del Coronado, which was completed in 1888. Across Spanish Bight, North Island had not yet been developed.

The 1930 1:62,000-scale map of San Diego shows the development of the US naval station and aviation fields on North Island. Also, the area just south of Hotel del Coronado shows a number of tightly packed buildings. This was known as Tent City, a tourist/vacation area where the original tents were gradually replaced with cottages. Tent City was torn down in the early 1940s.

On the 1953 1:24,000-scale map, Spanish Bight is no longer shown. This area was landfilled in 1944 to provide more land for the naval base.

The 1967 1:24,000-scale map shows Coronado Bridge, which was probably still under construction, as it wasn’t officially opened to the public until 1969.

Stories such as these are easy to find. The USGS Historical Topographic Map Explorer captures your imagination and reveals the past.
Browse through the maps of areas you are interested in to admire the quality of detail that these historical maps provide. Once you find that interesting place where you made that connection, share it with others using the Facebook and Twitter links at the upper right of the app.

Click the third icon to easily e-mail a link to your current map view. The app will save the map extent layers you have added.

Work on the map collection continues. Behind the scenes, an image service is used to catalog the maps. Current work is focused on developing an application to easily allow updates such as adding missing maps, editing metadata, and adding different types of maps.
To learn more about the USGS Historical Topographic Map Explorer, see
- 175,000 US Historical Maps—Now Online
- USA Historical Topo Maps
- USA Historical Topo Maps 1:25,000 Scale
- New York to LA: History of America’s Maps in One App
- Historical USGS topographic quads
To learn more about mapping and start learning GIS, visit the new Esri self-study site Learn ArcGIS.