In this tutorial series, explore four interactive maps and apps to learn how they surpass the traditional understanding of cartography. Discover an app that maps the health of the ocean and find out how interactive maps allow you to explore 3D phenomena and steer the data’s visualization.
Explore 3D data
A web scene is like a three-dimensional web map. While static maps depicting 3D data have long existed, they come with challenges. For example, unless a user can see 3D data from all angles, it can be difficult to view. To get started, find out how interactive scenes allow for enhanced viewing.
1. Open the 3D Ocean Explorer app.
2. Click Explore data.
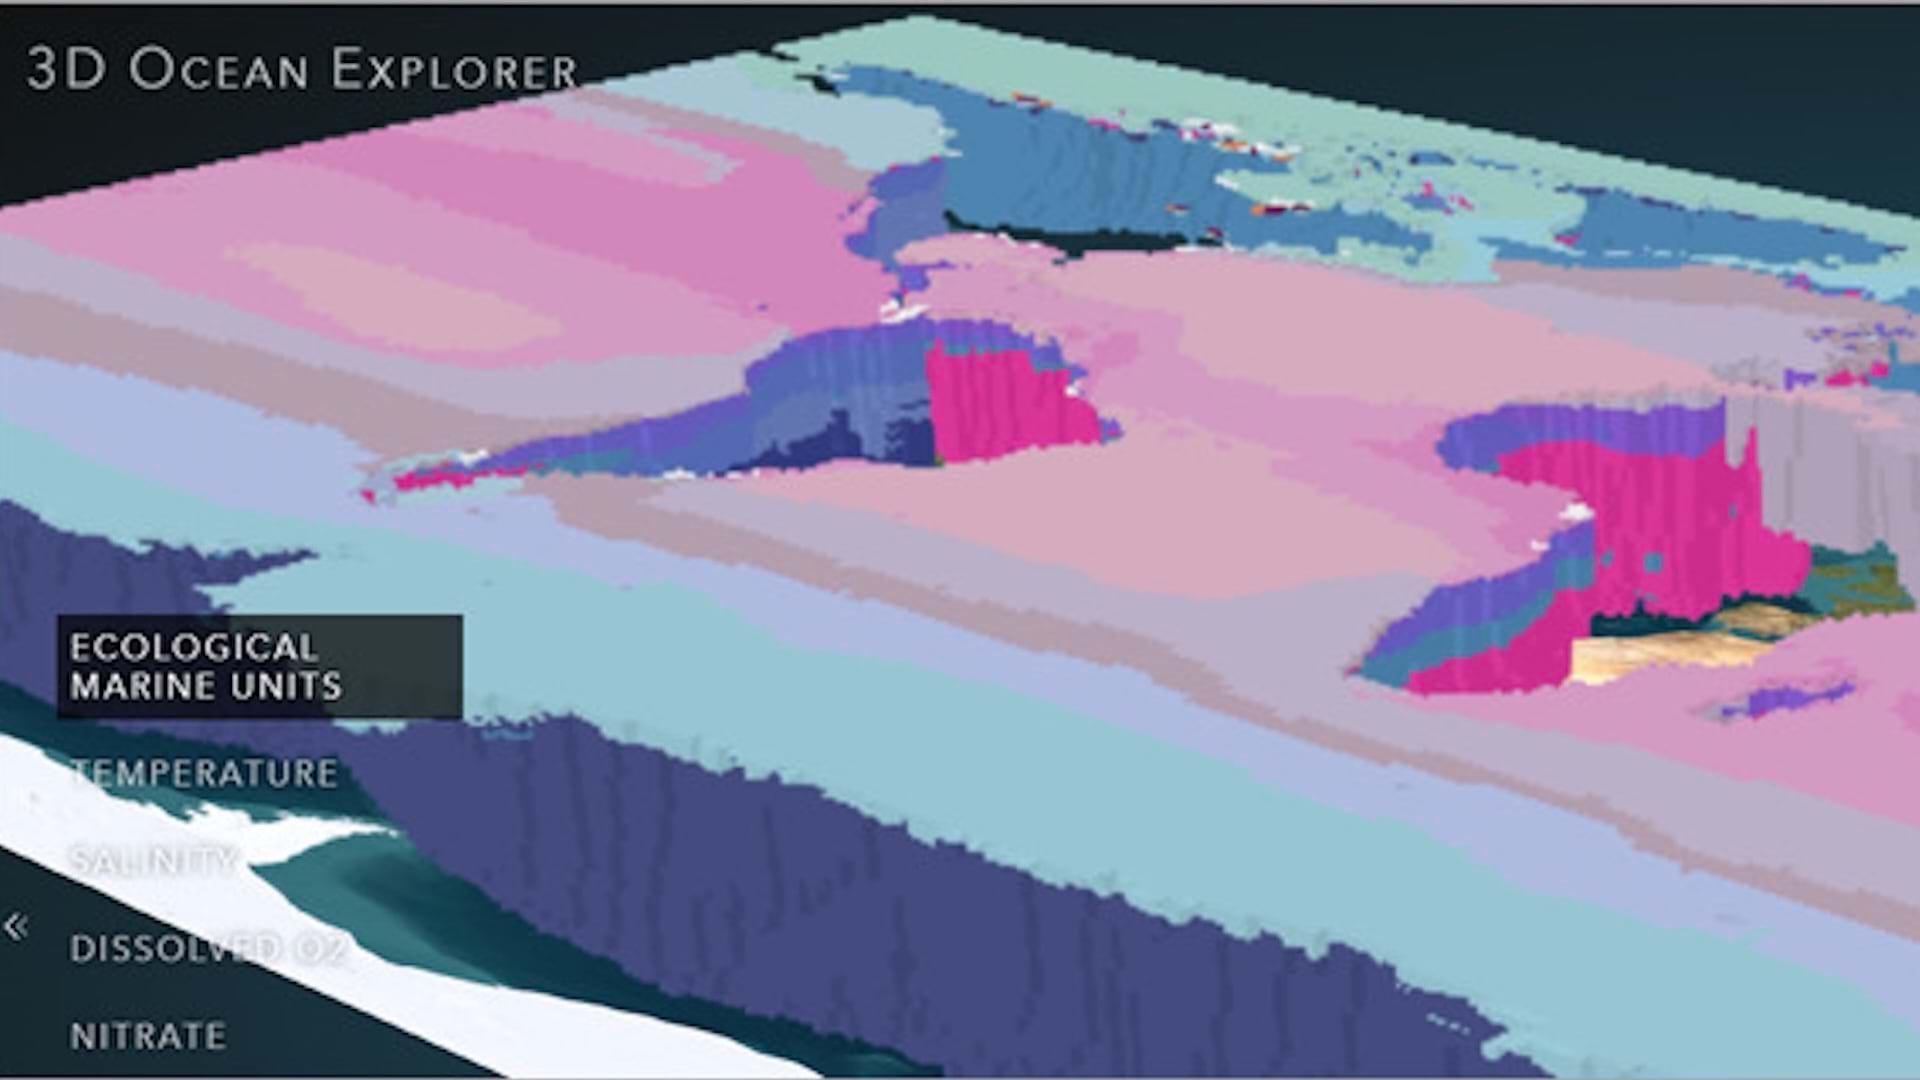
A 3D map of the world’s oceans appears.

The data in the app is from Esri, the US Geological Survey (USGS), National Oceanic and Atmospheric Administration (NOAA), National Aeronautics and Space Administration (NASA), US Fish and Wildlife Service (USFWS), National Institute of Water and Atmospheric Research (NIWA), Duke Marine Geospatial Ecology Lab, GRID-Arendal, Woods Hole Oceanographic Institution, and the University of Auckland.
3. On the left side of the map, click Nitrate.

Nitrate is the main nutrient required for photosynthesis. The map refreshes to show the nitrate data variable. Higher concentrations of nitrate are shown in red, and lower concentrations are shown in yellow.

The 3D nature of this map allows you to see how nitrate levels vary over the surface of the ocean as well as at different depths. However, you can currently only see the depth variation along coastlines and the edges of the map.
4. On the right side of the map, click the expander button. A control panel appears.

5. At the top of the control panel, turn on the Enable slice toggle button. Click Horizontal slice.

On the map, an arrow tool appears over the Arctic Ocean.
6. Drag the tool up and down to expose the data at different depths.

By interacting with the data, you can explore all three of its dimensions and discover patterns that aren’t visible in two dimensions alone. For example, as ocean depth increases, nitrate also increases, but not evenly. At middle depths, the northern Pacific Ocean is dark red, while the northern Atlantic Ocean is light orange.

The ocean is an inherently three-dimensional space that greatly benefits from this 3D treatment. Static maps can depict individual slices of the ocean as small multiples, but the 3D Ocean Explorer app can depict all parts of the ocean at once.
To learn how to make a 3D scene, try the tutorial Create a scene.
Explore further with interactive controls
Next, you’ll explore some of the other interactive controls in the 3D Ocean Explorer app. These controls affect what data is shown on the map and give control to the map reader. Controls like this are common to many interactive maps and apps, being especially helpful for exploring 3D data.
- In the control panel, turn off Enable slice and turn on Enable section.

2. Experiment with the Longitude and Orientation sliders. This tool provides another way to explore the 3D data.

3. In the control panel, turn off Enable section and turn on Display isosurface.

The scene displays all parts of the ocean where the nitrate concentration is 20 micromoles per liter (μmol/l).

4. Right-click and drag to tilt the scene.
You can now see how areas of 20 μmol/l extend deep into the north Atlantic while remaining close to the surface for all other parts of the ocean.

5. Explore the app further by experimenting with the other options in the control panel and changing the displayed variable on the left side of the scene.