In this tutorial, you’ll create a web map of Paris, France, using Map Viewer in ArcGIS Online. An ArcGIS web map is an interactive display of geographic information that you can use to tell stories and answer questions. Web maps contain a basemap, a set of data layers, and navigation tools to pan and zoom. The Map Viewer application allows you to create and manage your content as well as customize and configure how your map looks.
Note: This tutorial can be completed without an ArcGIS account. However, to save the map, you must have a free ArcGIS public account or a User or higher member role in your ArcGIS organization.
Navigate the Map
You can move around a map by panning, zooming, and searching.
1. Open ArcGIS Online.
2. If you have an ArcGIS account as described in the introduction, click Sign In and sign in to your account with your credentials.
If you don’t have a suitable ArcGIS account, you can still complete this tutorial but you will not be able to save the map.
3. On the ribbon, click the Map tab.

Map Viewer includes two vertical toolbars: the Contents (dark) toolbar and the Settings (light) toolbar. Use the Contents toolbar to manage and view the map contents and work with the map. Use the Settings toolbar to access options for configuring and interacting with map layers and other map components.
Tip: You can click the Expand or Collapse button at the bottom of each toolbar to expand or collapse it.
4. Zoom to Europe. There are two ways to zoom:
- Click Zoom In and Zoom Out to change the scale of the map. Pan the map by dragging the map in any direction to change the extent of the map.
- Scroll using your mouse wheel or press Shift and draw a box around the area you want to zoom in to.

Next, you’ll change the basemap to have a different view of the earth while you explore. A basemap provides a background of geographical context for the content you want to display on a map.
5. On the Contents toolbar, click Basemap. The Basemap pane appears.

6. In the Basemap pane, choose the Imagery Hybrid basemap.
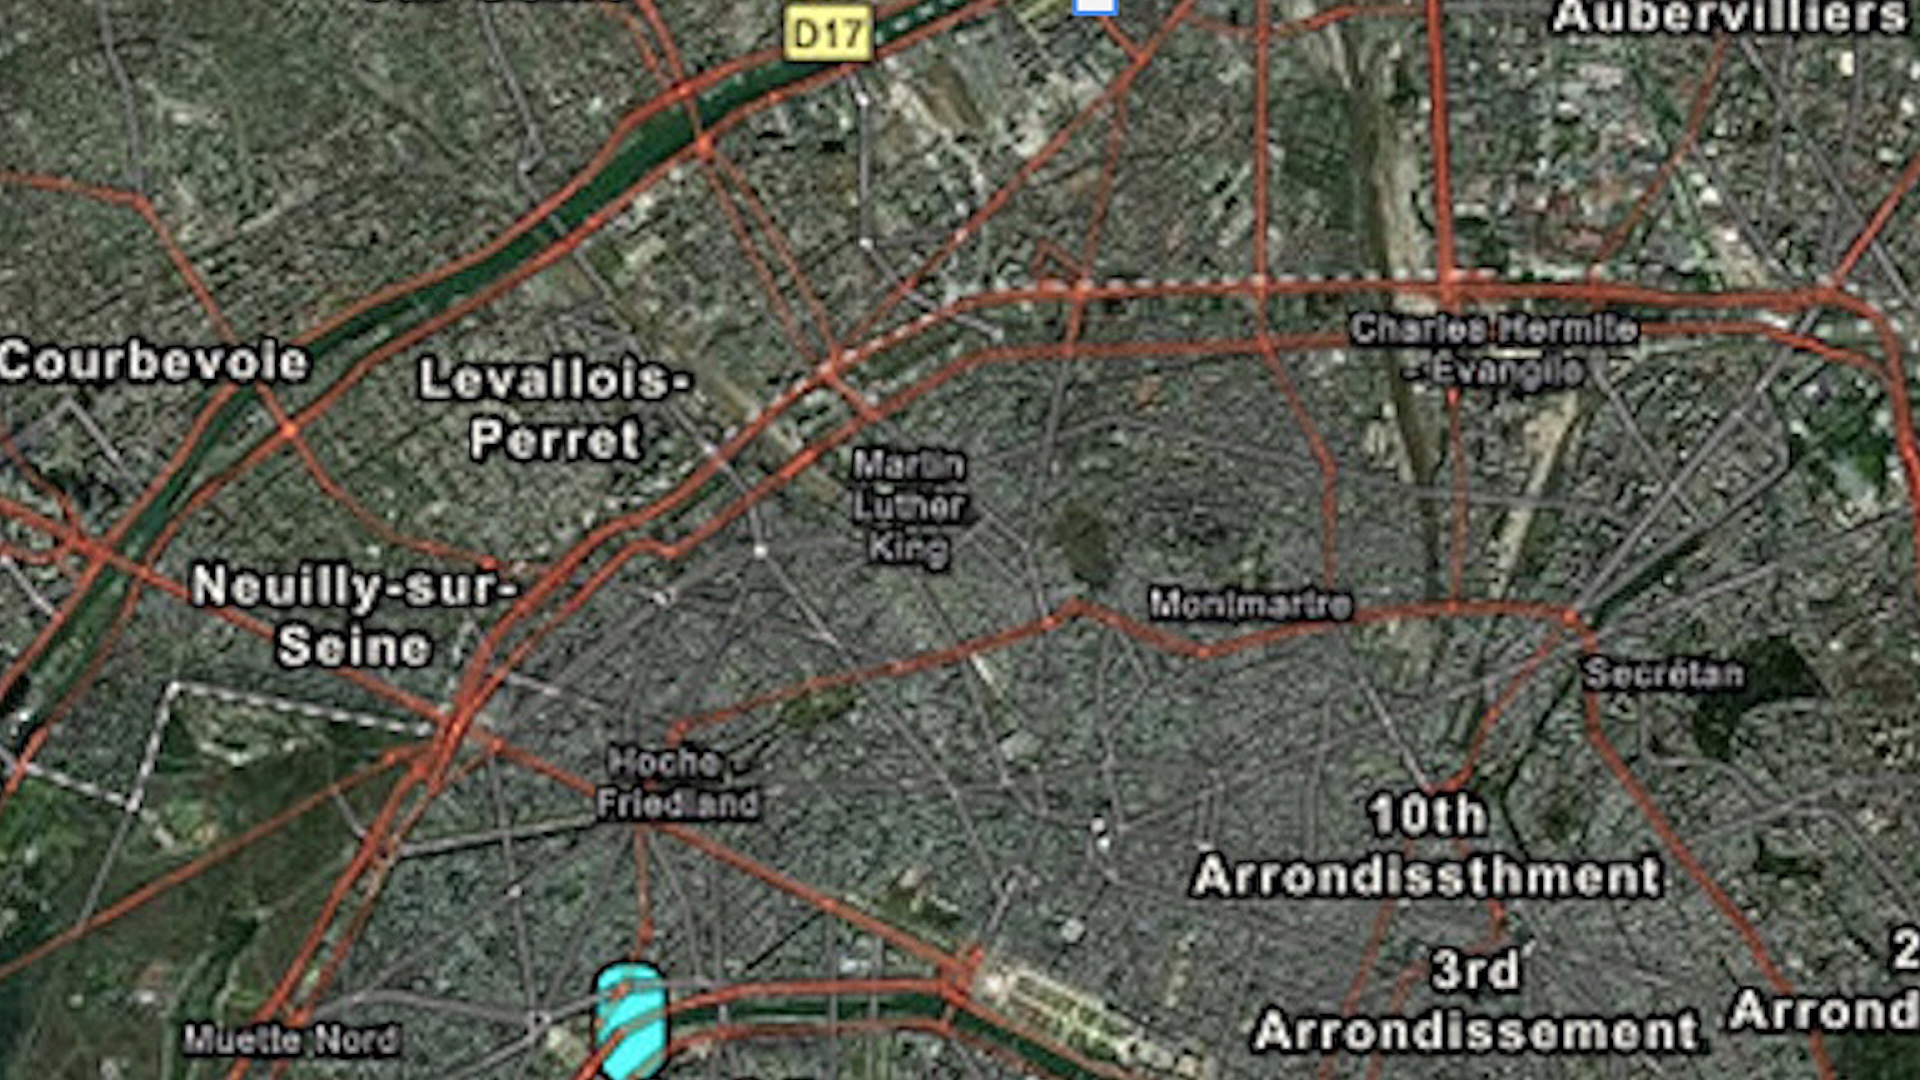
Your map updates to show the Imagery Hybrid basemap, which includes satellite imagery of the earth’s surface with labels of roads and important places.

7. Explore the new basemap by zooming and panning.
As you zoom in, more labels appear, and the imagery becomes more detailed. The basemap is a multiscale map, so it shows different information at different scales.
Next, you will navigate to the Eiffel Tower in Paris, France.
8. Click Search on the map. The search bar appears in the upper corner of the map.

9. In the search bar, type “Eiffel Tower” and press Enter.

The map zooms to Paris where the Eiffel Tower is located. A pop-up appears over the famous landmark.

Mark Locations
In Map Viewer, making a sketch allows you to create features on a map. A sketch layer is a type of feature collection that helps you create features to symbolize something you’d like to show on the map.
Next, you’ll use the Sketch tool to mark the Eiffel Tower as a location of interest.
1. In the Search result pop-up, click Add to new sketch.

A marker appears on the map. The Sketch pane and the sketch toolbar also appear. You’ll change the color of the sketch marker.

2. On the sketch toolbar, click Select, then click the Eiffel Tower marker on the map. The marker is outlined in cyan to indicate it is selected.

3. In the Sketch pane, scroll down to Vector marker and click the pencil under Fill color.

4. In the Select color window, in the box next to the # symbol, type “00ffff” and click Done.

The marker on the map changes to cyan, which is easier to see against the busy basemap.
5. Click anywhere on the map to deselect the point.

6. Close the Sketch pane.
7. On the Contents toolbar, click Layers to open the Layers pane.
A new layer named Sketch will be listed in the pane.

Next, you will create a bookmark. Bookmarks provide shortcuts to places on a map.
8. On the map, click Search to open the search bar.
9. In the search bar, type “Paris” and press Enter.
The map zooms out to show the entire city of Paris.
10. On the Contents toolbar, click the Bookmarks button. On the Bookmarks pane, click Add bookmark.

11. For Title, type “Paris”, then click Add.

You now have a bookmark of this map extent that shows the entire city of Paris.
12. Close the Bookmarks pane and the pop-up.
Now that you’ve marked locations in two ways, you’ll explore how to change the zoom level and extent of your map to see the two marked locations.
13. On the map, click the Eiffel Tower point.
A pop-up for the point appears.

14. On the pop-up, click Zoom to three times. Each time you click Zoom to, the map zooms closer to the Eiffel Tower.

15. Close the pop-up.
16. On the Contents toolbar, click Bookmarks and then click Paris.
The map zooms back out to show the extent of the city. You can also see the Eiffel Tower symbol you created earlier in the tutorial.

In this tutorial, you learned how to explore a map by panning, zooming, and searching. You also learned how to mark locations with sketch tools and bookmarks. For a future project, try creating a map of another location, such as your hometown or a city you’d like to visit, and set up markers and bookmarks for important locations.
Visit the Esri tutorial gallery to explore additional topics and find other step-by-step workflows on a variety of products.