For this tutorial, you are working with the parks and recreation department in New York City to help plan a citywide tree-trimming initiative. Due to recent storms, many trees are at risk of falling, requiring immediate attention. The department needs to update geographic tree-trimming data to prioritize high-risk areas.
Field crews have given you data for planning the tree-trimming activities for Brighton Beach, Brooklyn, where winds tend to be high during storms. The updated data will help streamline the tree-trimming process and ensure that resources are efficiently allocated.
In this lesson, you’ll learn how to use ArcGIS Web Editor to select, create, copy, move, and reshape individual features.
Requirements
- Publisher or Administrator role in an ArcGIS organization: ArcGIS Online (see options for software access) or ArcGIS Enterprise (learn more)
Set Up a Web Map for Editing
To work in ArcGIS Web Editor, you must first create a web map that includes editable feature layers. To create a layer with these permissions, you’ll upload a zipped shapefile into ArcGIS Online or ArcGIS Enterprise and publish it. The resultant feature layer can be saved in a web map, which can then be opened in Web Editor.
1. Download the ConeyIsland_Pruning zip file, which is a shapefile.
Note for Safari users: If this file downloads as a folder, it may be a settings issue. See this article for help.
Next, you’ll sign in to your organizational account and upload the shapefile as a feature layer. This will give you full editing control of the layer.
2. Sign in to your ArcGIS organizational account or ArcGIS Enterprise using a named user account.
Note: If you don’t have an organizational account, see options for software access.
3. On the ribbon, click the Content tab. Click New item.

The New item window opens.
4. Drag the ConeyIsland_Pruning.zip file to the New item window.
The ConeyIsland_Pruning.zip file is added to the New item window.
Tip: If you prefer to browse directly to the file, click Your device. Browse to and select the ConeyIsland_Pruning.zip file. The ConeyIsland_Pruning.zip file is added to the New item window.
5. In the New item pane, for File type, choose Shapefile. For How would you like to add this file?, select Add ConeyIsland_Pruning.zip and create a hosted feature layer.

6. Click Next.
7. For Title, type Coney Island pruning tutorial and add your name or initials. For Categories, choose Environment.
Note: You cannot create two layers in an ArcGIS organization with the same name. Adding your initials to a layer name ensures that other users in your organization can also complete this tutorial. Once a layer has been created, you can rename it in the map to remove your initials, which will not affect the name of the underlying data layer.
8. For Tags, add the following tags, pressing Enter after each:
-
- NYC
- pruning
- tutorial
- planning
- storms
9. For Summary, type or copy and paste the following: This shapefile contains a point layer representing trees and a polygon layer representing priority pruning areas.
10. Click Save.
The new feature layer is added to your content, and the item page opens. In the Layers section, two sublayers are listed: Tree_Locations and Priority_Areas.
Now that you’ve created your layer, you’ll add it to a web map. The web map can be accessed in Web Editor.
11. On the Coney Island pruning tutorial item page, click Open in Map Viewer.

Map Viewer opens.
12.On the Contents (dark) toolbar, click Save and choose Save as.

13. In the Save map window, enter the following information:
-
- For Title, type Coney Island pruning tutorial map.
- For Categories, choose Environment.
- For Tags, type NYC, pruning, tutorial, planning, and storms.
- For Summary, type This map contains a point layer representing trees and a polygon layer representing priority pruning areas.
14. Click Save.
The web map is added to your content. The map is ready to be opened in Web Editor.
15. On the ribbon, click the app launcher button and choose Web Editor.

The Web Editor app opens in a new tab. Web Editor allows you to complete quick editing workflows. For an overview of the app, including the Web Editor interface, visit the Introduction to Web Editor documentation page.
Note: If you are opening Web Editor for the first time, you’ll receive a message to open a web map to begin. You can optionally check the box next to Don’t show me this message again and continue.
16. On the Contents (dark) toolbar, click Open map. In My content, locate the Coney Island Pruning tutorial web map and click Open map.

The web map opens and zooms to Brighton Beach, Brooklyn, New York City. The map shows the two sublayers from the feature layer you added earlier. Points represent trees, and the polygon represents the area designated as high priority for pruning operations.
Note: If necessary, you may need to zoom out to see the complete extent of the polygon. Also, the colors shown on your map may be different from those shown in the images.
The web map defaults to the basemap set by your organization. To better visualize the trees, you’ll switch the basemap to one showing satellite imagery.
17. On the Contents toolbar, click Basemap. Choose the Imagery Hybrid basemap.
The basemap for the web map changes to an imagery-based layer with street names.
Create a Feature
First, you’ll add several trees that technicians noticed while they were surveying storm damage. These trees have suffered storm damage and need attention from maintenance crews. However, they were not captured in the tree census, so you’ll add them to the layer to ensure that crews revisit them later.
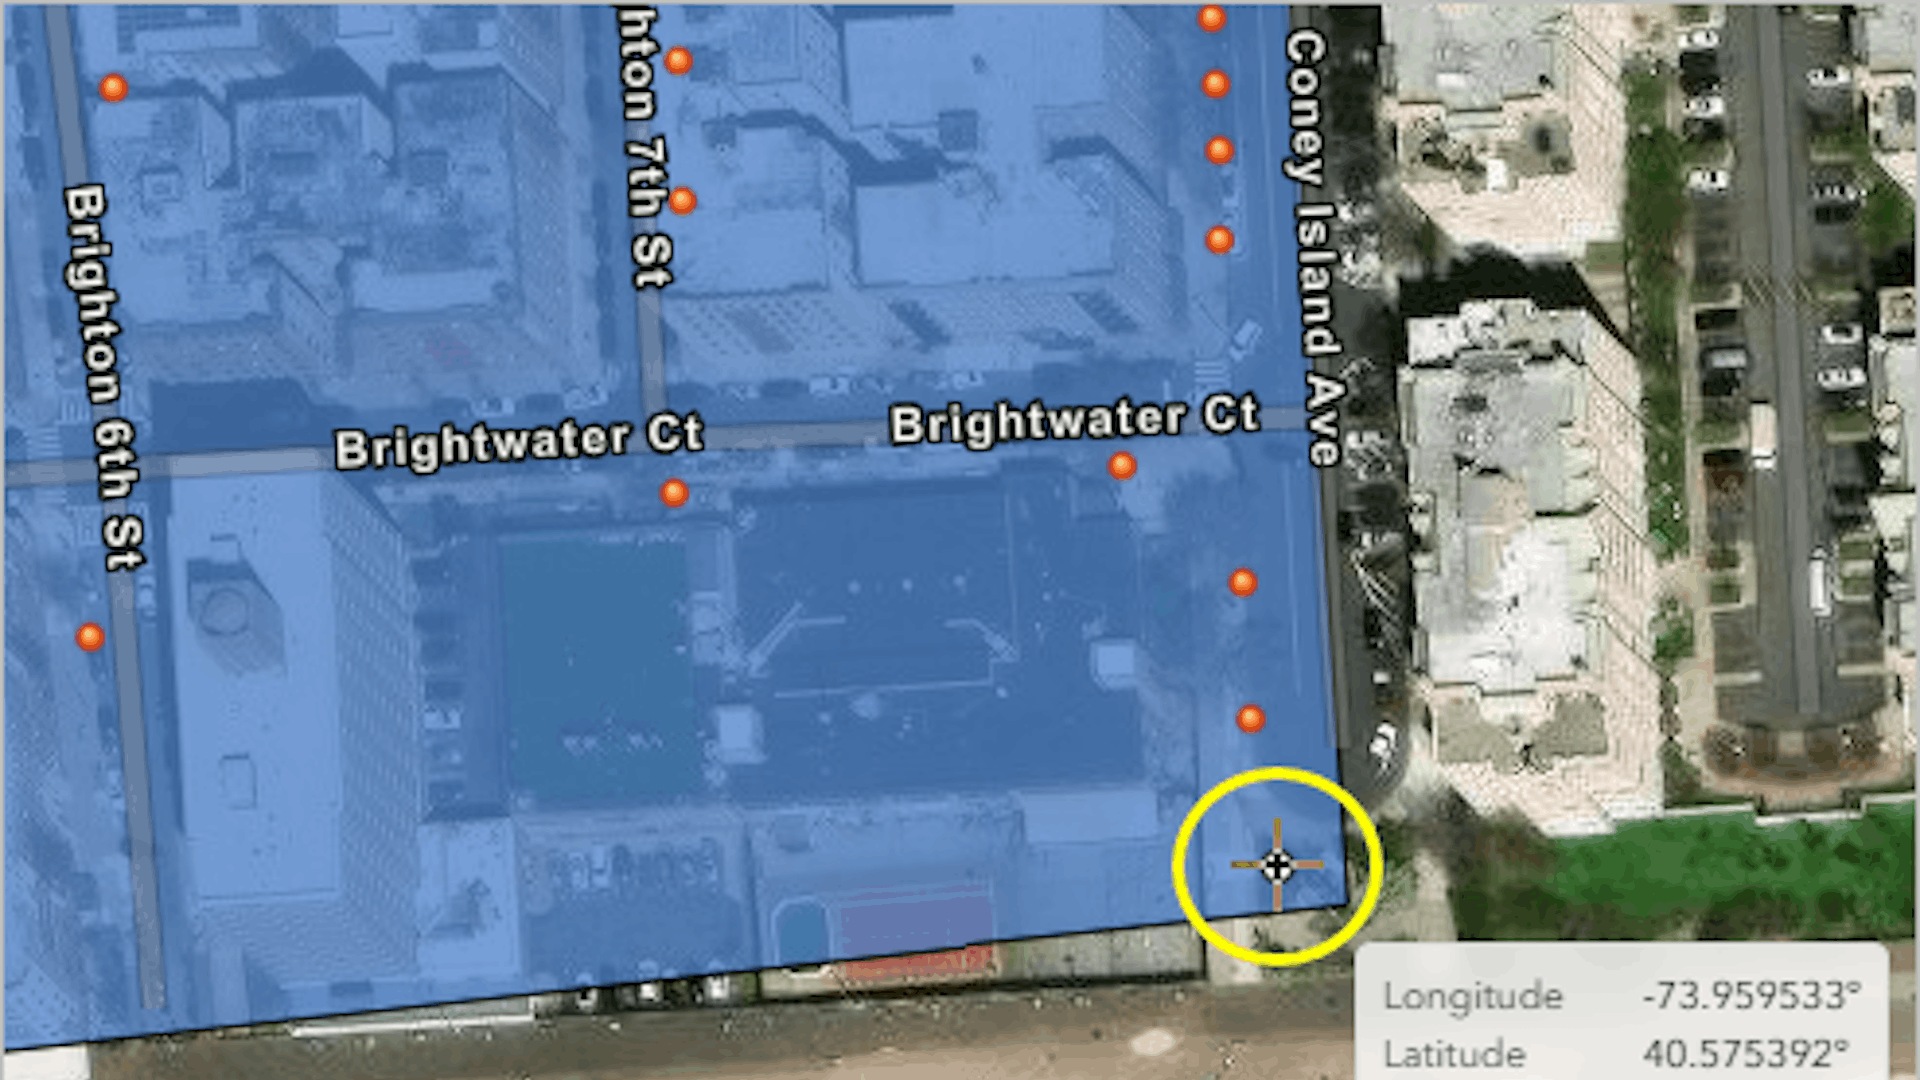
1. On the general toolbar, click Search. Copy and paste the address 3300 Coney Island Avenue, Brooklyn, NY and click Search to locate it on the map.

The map zooms to where the field crew found two new trees you need to put on the map.
2. Close the Search result pop-up.
3. On the Contents toolbar, click Layers.
The Layers pane appears.
4. Expand the Coney Island pruning tutorial group and click the Tree Locations sublayer to select it.

Note: A blue bar on the left of the layer indicates when it’s selected.
5. On the editing toolbar, click Create features.

The Create features pane opens.
6. In the Create features pane, for Tree Locations, click New Feature.

7. Click the map to place a tree on the end of the street south of Coney Island Avenue.

Once the feature is placed, the Create features pane updates to list attribute information for the new point. Attributes store information about the feature.
8. In the Create features pane, enter the following information:
-
- For Borough, type Brooklyn.
- For Tree_ID, type 1066899.
- For Status, type Completed.
9. In the Create features pane, click Create.

You have digitized a new tree location. Next, you’ll add another tree the technician noticed while they were out inspecting.
Copy, Paste, and Move a Feature
In addition to creating new features from scratch, you can copy and paste ones that are already on the map. With this method, the new feature will have the same attributes as the original.
1. If necessary, select the feature you just created.
Note: Selected features are highlighted in blue.
2. On the general toolbar, click Copy.

3. On the general toolbar, click Paste. In the Create features pane, click Create.

A copy of the selected tree feature is pasted on top of the first. You’ll move the copy to a location slightly east.
4. If necessary, on the editing toolbar, click Move. Drag the new tree to the east of the tree you just created, in front of the beach-facing building.

5. On the editing toolbar, click Clear selection to deselect the tree.
Next, you’ll expand the Priority Areas polygon to include the new trees.
Reshape Features
Now that you’ve added the additional trees that field crews need to perform maintenance on, the Priority Area polygon needs to be extended to include these trees. Web Editor has several tools for reshaping features: Vertices, Reshape, and Split.
- The Vertices tool is used to change the shape of a feature by moving, adding, or deleting vertices.
- The Reshape tool is used to add or remove geometry from features. Reshape includes the same drawing tools available when creating features, so it is a versatile choice for editing.
- The Split tool is used to divide a feature to create two separate features.
You’ll start by selecting the feature you want to edit.
1. On the selection toolbar, click Rectangle select.
The pointer changes from the Pan tool to the Select tool. When the Select tool is active, you can click a feature to select it or draw a rectangle to select multiple features.
2. Click the Priority Areas polygon to select it.

The polygon is highlighted in blue. Once the shape is selected, the relevant tools on the editing toolbar become active.
3. On the editing toolbar, click Vertices.

Vertices are the points where two or more line segments or curves meet. In the case of the Priority Areas polygon, there are four vertices defining the four corners of the polygon.
4. Drag the southwest vertex to include the two tree locations you just created.

5. On the editing toolbar, click Clear selection to deselect the Priority Areas polygon.
In this tutorial, you used the basic editing tools in Web Editor to create and update data. These tools and more can be used to edit, create, and update your data. Refer to the Web Editor documentation for help using specific functionalities within Web Editor.
To learn more about Web Editor, try the following resources:
- Watch the Introduction to Web Editor video to learn how to access Web Editor and select and edit features.
- Read this ArcGIS Blog article to learn five editing tips and tricks.
- Learn how to add a utility network to Web Editor in ArcGIS Enterprise.
Acknowledgments
- Tree data is derived from the NYC Parks Tree Pruning Dataset. Source: City of New York.
- Imagery Hybrid map sources: Esri, Maxar, Earthstar Geographics, TomTom, Garmin, FAO, NOAA, USGS, OpenStreetMap contributors, and the GIS user community
Visit the Esri tutorial gallery to explore additional topics and find other step-by-step workflows on a variety of products.