The US Geological Survey estimates there are 1,350 potentially active volcanoes across the globe and 170 potentially active volcanoes in the United States.
In December 2023, a new fissure opened on Iceland’s Reykjanes Peninsula. In mid-January 2024, the same fissure erupted again, forcing evacuations of Grindavik for the second time in a month. Spain’s Cumbre Vieja volcano, on the island of La Palma, erupted in 2021 and engulfed and destroyed nearly 1,500 homes and buildings. In Hawaii, Mauna Loa erupted in late 2022, its first eruption since 1984. Also in Hawaii, Kīlauea volcano is once again active, with its inner crater—Halemaʻumaʻu—erupting from a vent along its western wall.
ArcGIS Living Atlas of the World includes authoritative live feeds and other content that helps you learn more about volcanic activity around the world. Follow these steps to quickly make your own map of volcanic activity using ArcGIS Online and ArcGIS Living Atlas of the World.
In this tip, you will use renders to explore imagery from the Sentinel-2 Level-2A service to examine the 2022 Mauna Loa eruption.
Make a Map of Volcanic Activity
Step 1: Sign in to your ArcGIS Online account and select the Map tab to open Map Viewer. Click Open in Map Viewer Classic near the upper right corner. (Some functionality used in these steps is not yet supported in Map Viewer, but will be available in a future release of Map Viewer.)
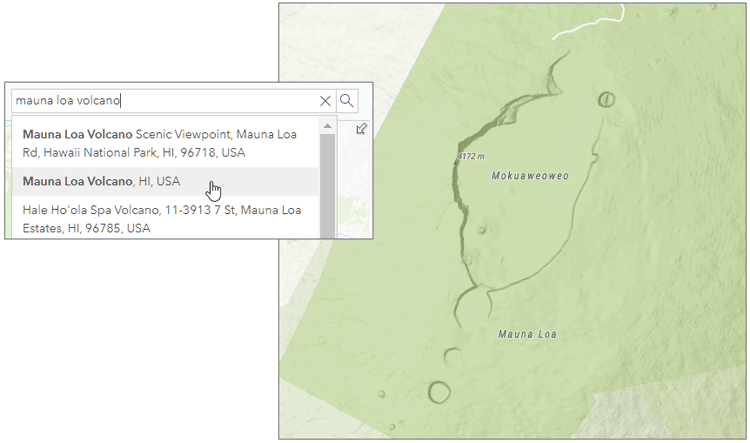
Step 2: In the search bar on the right side of the toolbar, search for “Mauna Loa volcano, HI, USA” then zoom in to view the Moku’aweoweo Caldera, which appears in the map as “Mokuaweoweo.”
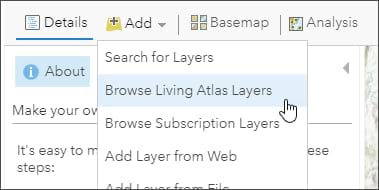
Step 3: Click Add on the left side of the toolbar, then Browse Living Atlas Layers.
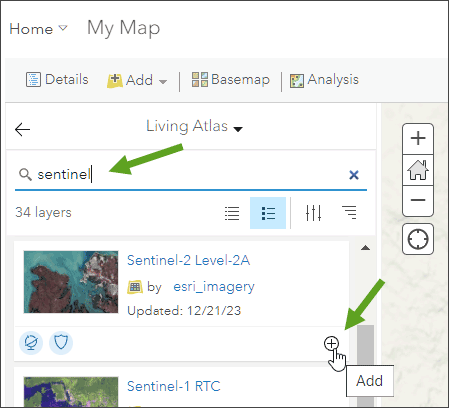
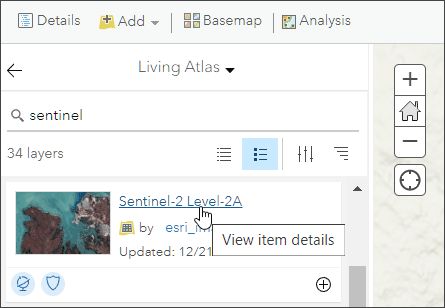
Search for “sentinel” and find the Sentinel-2 Level-2A layer. Click (+) to add the layer to your map.
Tip: To learn more about any layer, click the layer title to View item details.
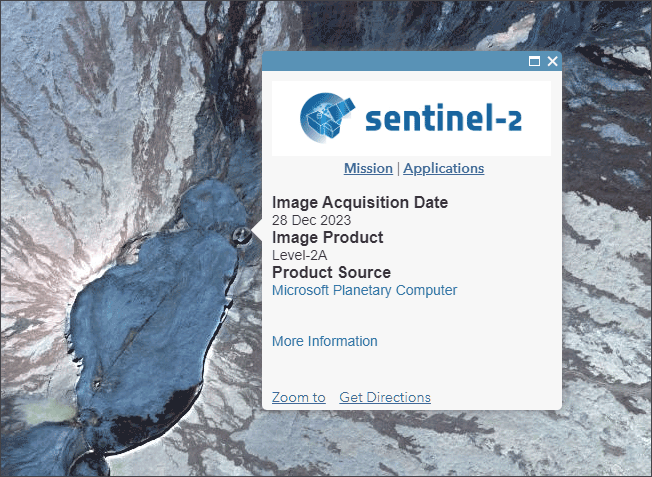
From the Sentinel-2 Level-2A item details, we can learn that it is multispectral, multitemporal global imagery sourced from the Microsoft Planetary Computer. The layer is updated daily with new imagery, with each point on Earth revisited every five days. Click the layer in the map to learn about the acquisition date, source, and additional details.
Mauna Loa erupted for about 12 days starting late in the evening of November 27, 2022. In the next steps, you will search for available Sentinel imagery during a major flow event on December 3, 2022.
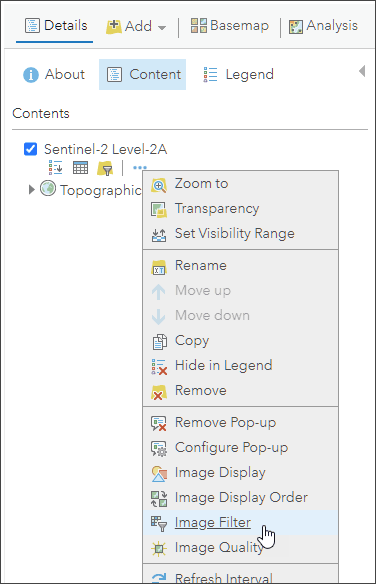
Step 4: After clicking on the arrow to the left of Living Atlas, open the Content panel, hover your mouse over the Sentinel-2 Level-2A text, then click the blue (…) icon under the Sentinel-2 Level-2A text to open a list of layer options. Choose Image Filter.
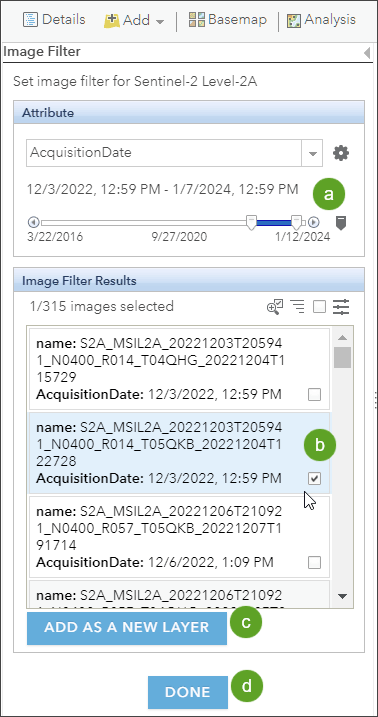
Step 5: Here you will add the desired imagery as a new layer.
(a) – Sentinel imagery is displayed by acquisition date. The range of available dates can be adjusted using the time slider under Attribute. By default, the slider is set to the current date. Adjust the left slider so the date range includes imagery from December 2022.
(b) – Under Image Filter Results, hover over each image to display the imagery coverage footprint in yellow on the map, then select the image that covers your area of interest best. Locate the Sentinel-2 imagery with the Acquisition Date 12/3/2022, 12:59 PM. Check the box to select it.
(c) – Click ADD AS A NEW LAYER to add the imagery to your map.
(d) – Click Done to return to Contents.
To glean more information from multispectral imagery sources such as Sentinel-2, you can choose a renderer that highlights specific characteristics of the imagery. You can choose renderers that highlight healthy vegetation, geology, moist areas, and more.
The default renderer is Natural Color with DRA (Dynamic Range Adjustment). Short-wave Infrared is appropriate for viewing active fires and hot spots, even through clouds or smoke.
Step 6: Hover over the newly added layer text and click the (…) icon under the text to open the layer options. Choose Image Display.
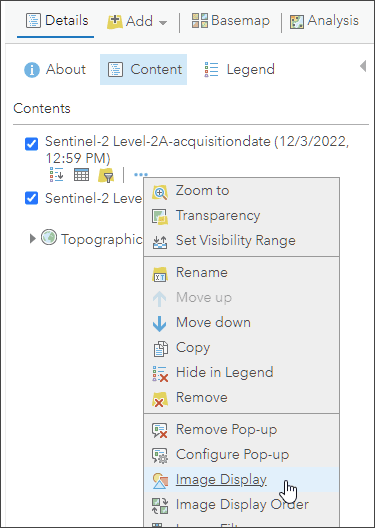
Step 7: From the Renderer list, choose Short-wave Infrared with DRA.
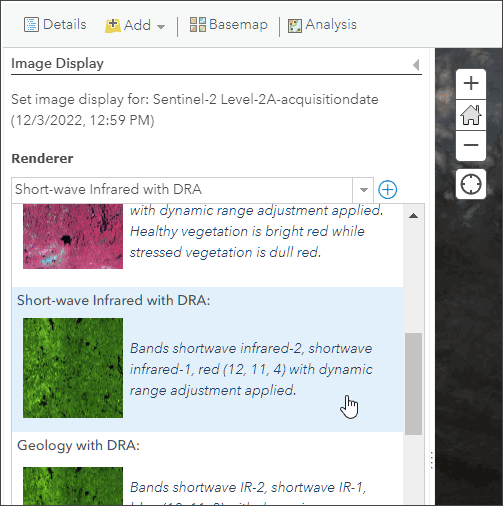
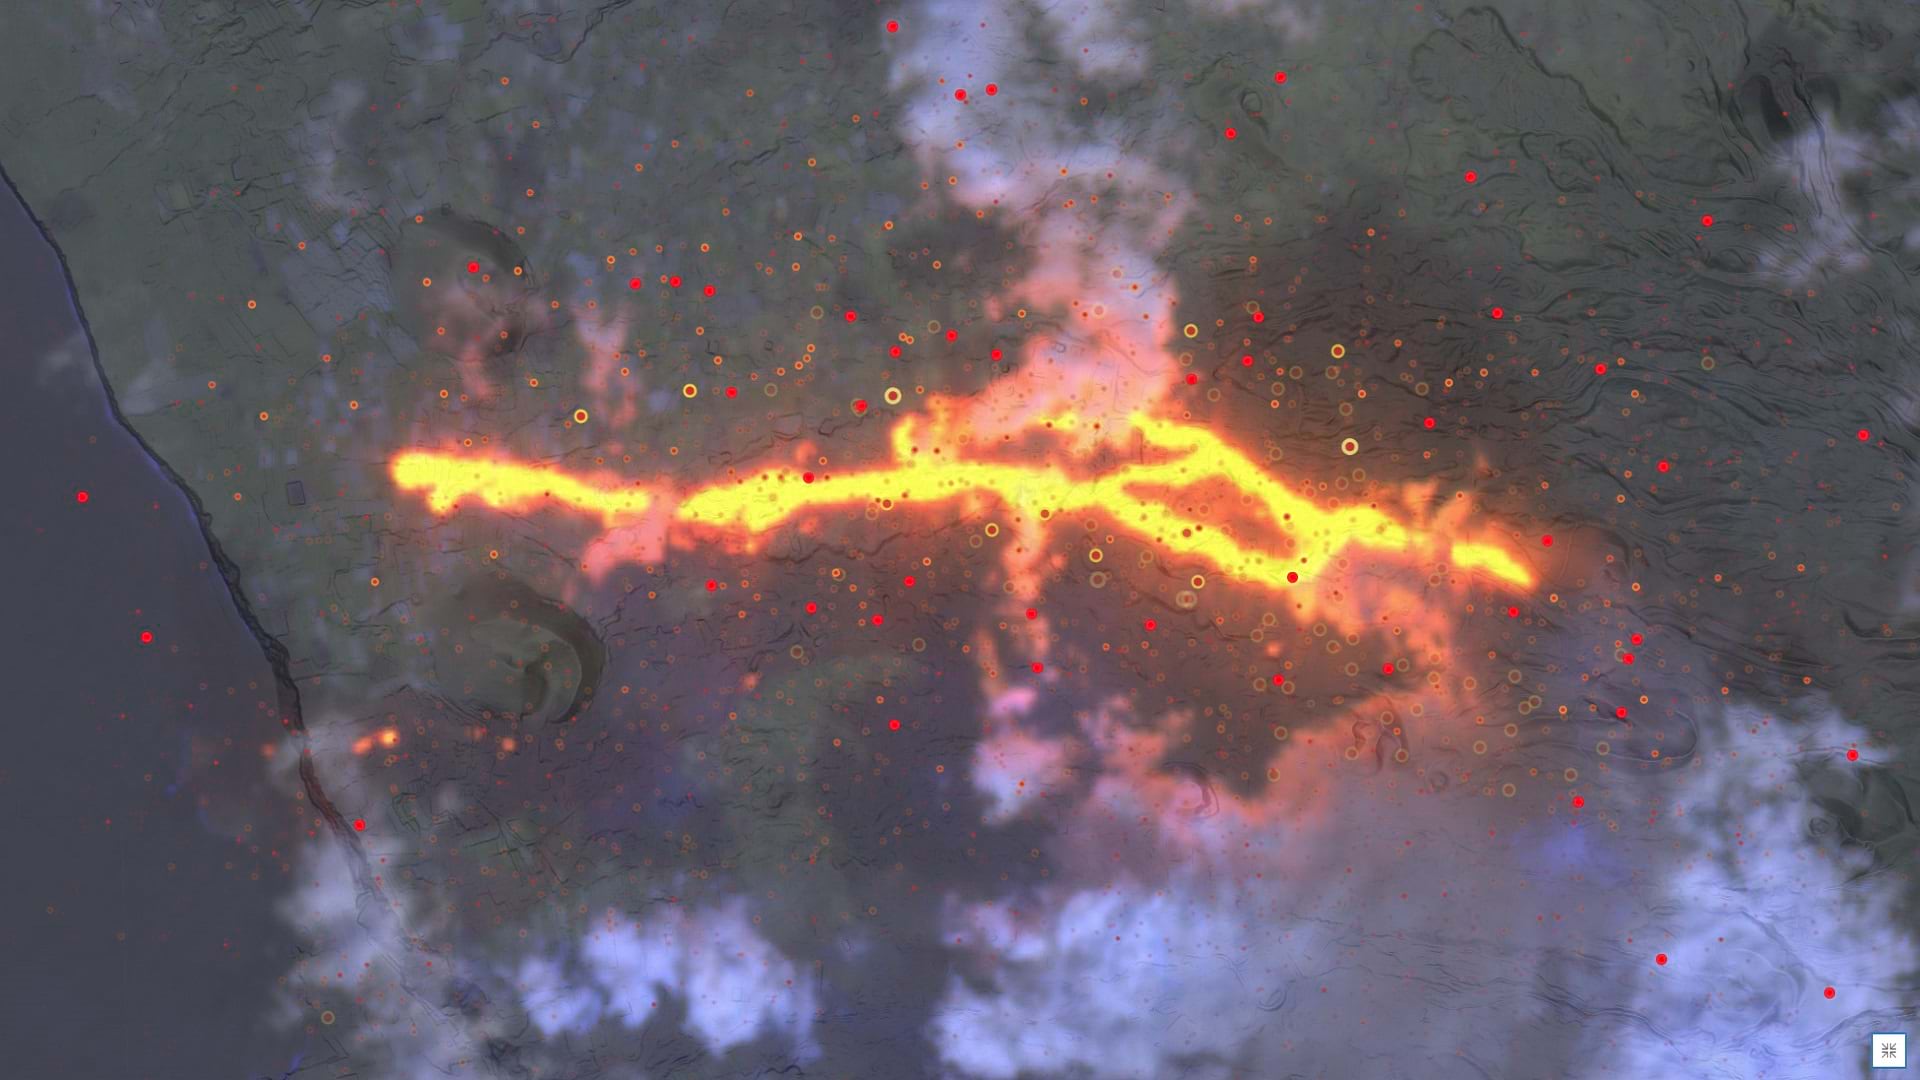
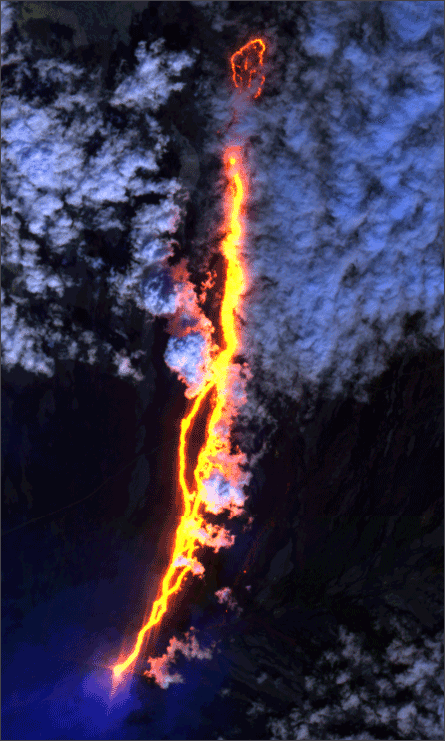
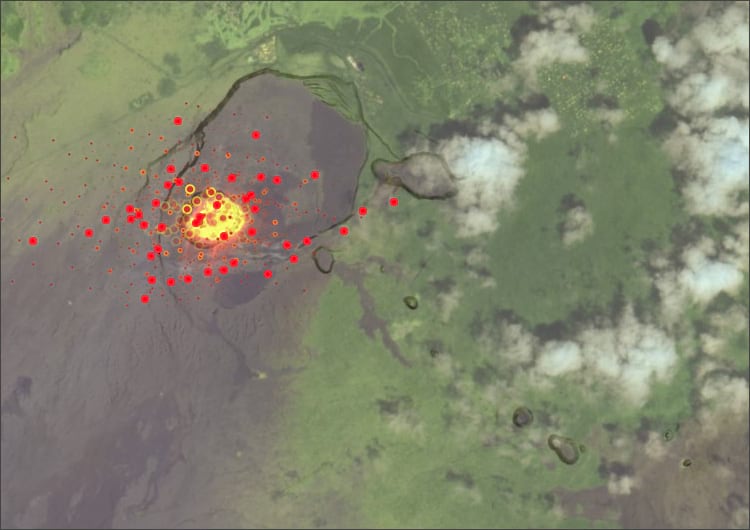
Click Apply, then Close. Using Short-wave Infrared, we can clearly see the eruption flow activity heading north and east from the crater. You may need to pan or zoom to show the entire flow.
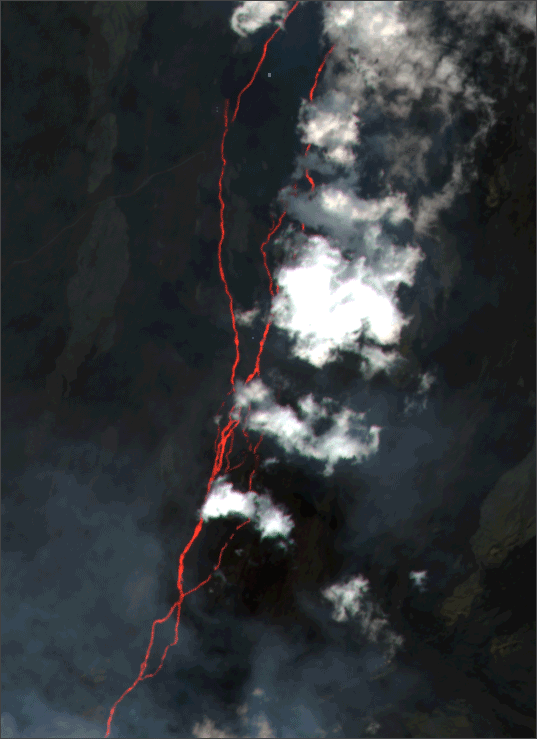
Step 8: Repeat steps 6 and 7, but choose Color Infrared with DRA from the Renderer list. Note the change from the previous layer.
Now you have completed a volcanic activity, displaying imagery from the 2022 Mauna Loa volcanic eruption. You can apply the steps above to visualize any other area of volcanic activity.
Finalize Your Map
Experiment with different basemaps and other settings until you get the desired results for your final map. Below, the basemap has been switched to a gray multidirectional hillshade and the Sentinel imagery has been adjusted with approximately 40 percent transparency. Make sure to save and title your map when finished.
More Information
For more information, explore the following: