Wind-generated electricity has existed in some form or another since the 19th century and has only increased in popularity and efficacy in recent years. As a renewable source of energy, the widespread adoption of wind power can help mitigate the effects of climate change caused in large part by reliance on fossil fuels.
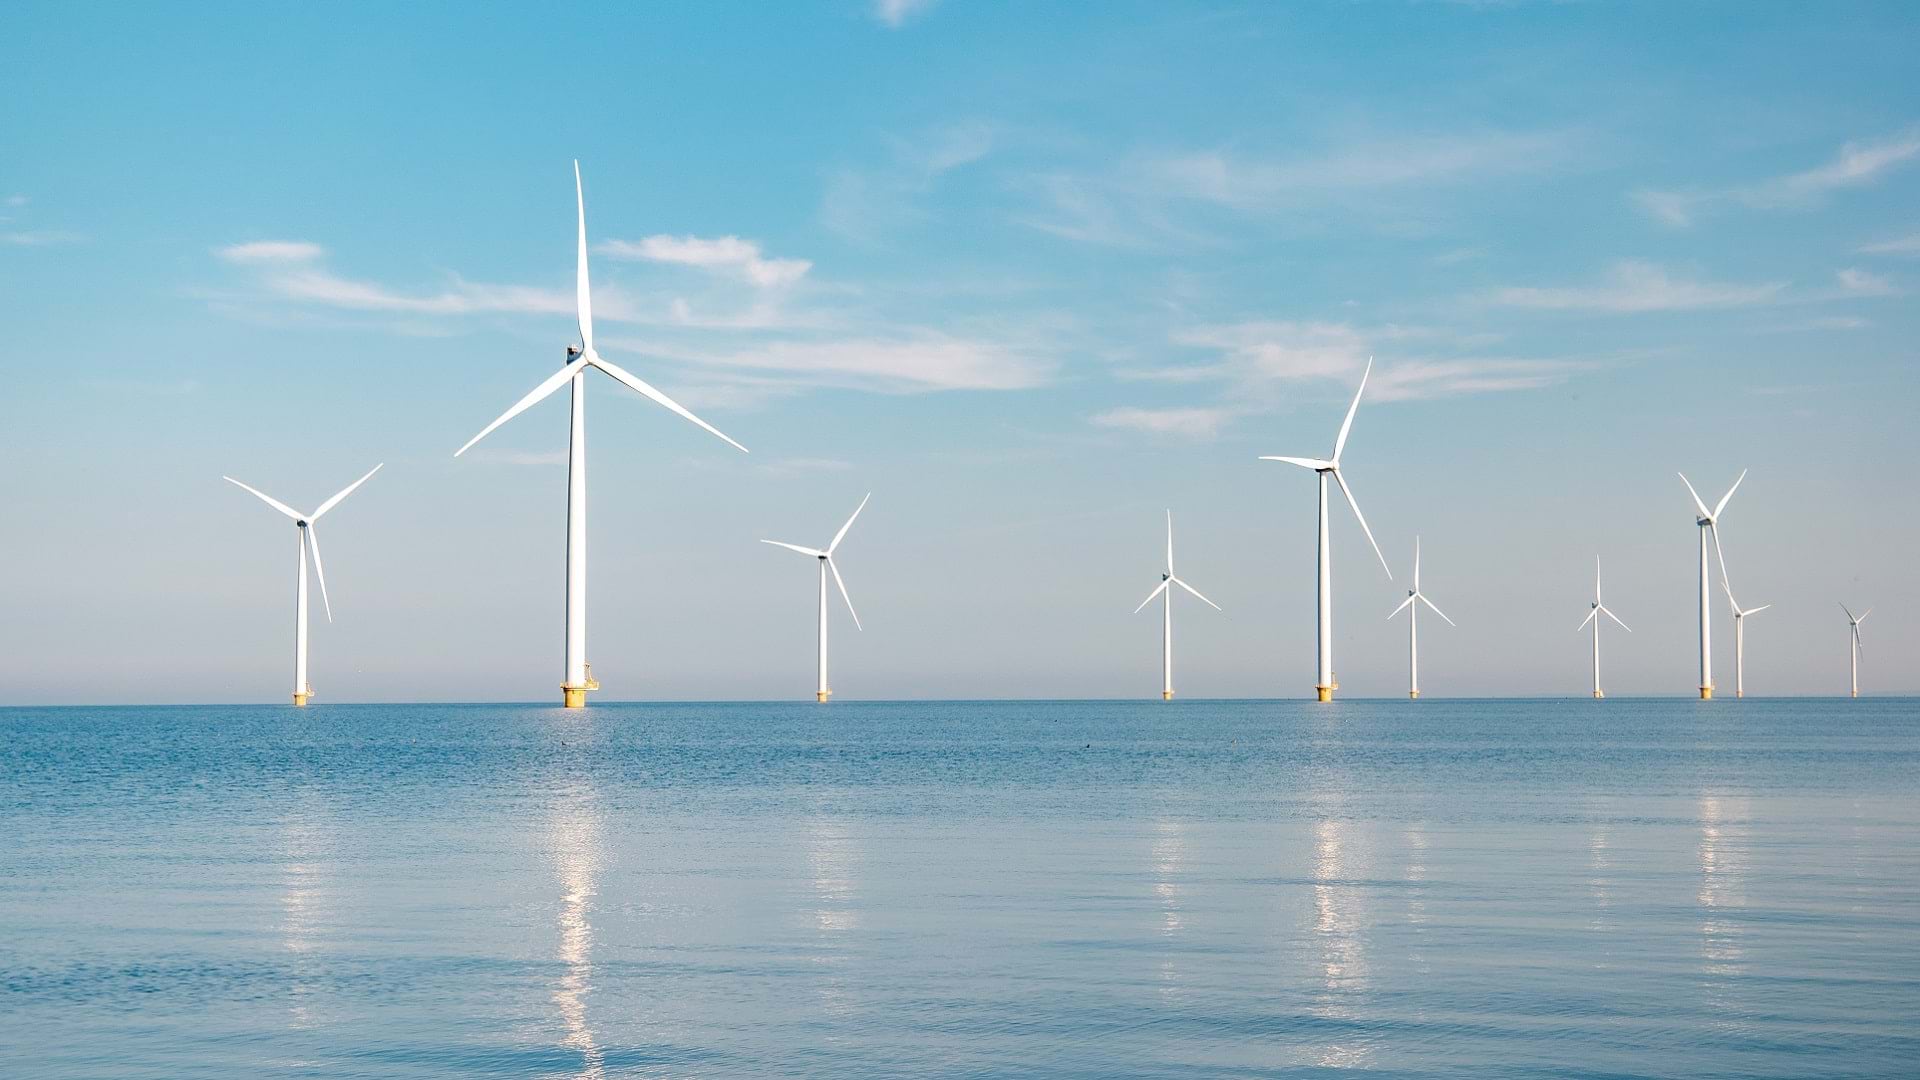
But construction of wind farms, where multiple turbines are clustered together to provide power for thousands of homes and businesses, is a costly, complex process. For one thing, not every location is suitable for wind farms. In order to generate a useful amount of power, they need to be built in areas where wind speeds are high and consistent, such as at sea.
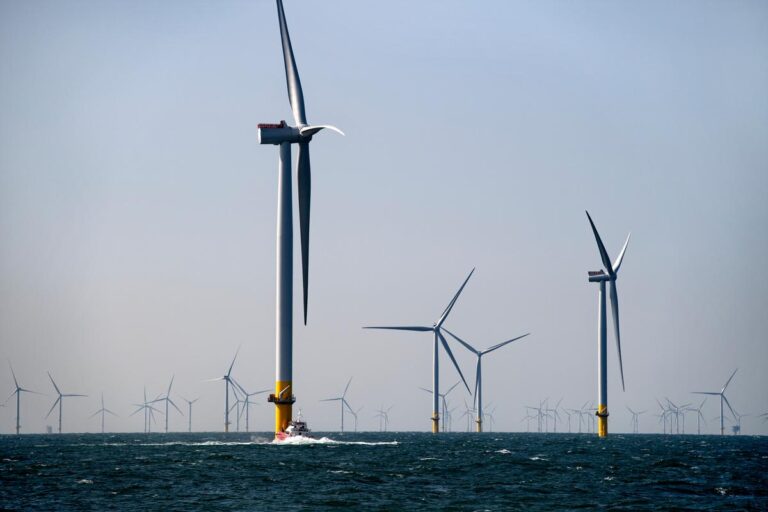
Danish sustainable energy company Ørsted designs, constructs, and operates wind farms, solar fields, bioenergy plants, and energy storage facilities. Many of its wind farms are offshore, where the process of construction and operation takes on even more layers of complexity.
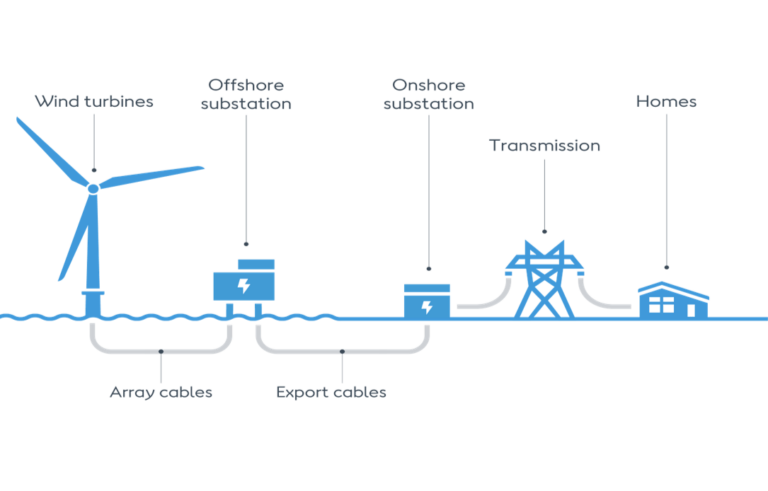
Electricity generated by its offshore wind farms is conducted by array cables that are trenched into the seabed and send the energy to an offshore converter station. The converter station has an export cable that sends the electricity to an onshore transition joint bay and cable. It is then transmitted to a substation and distributed to an electricity grid for consumption.
Ørsted has used GIS technology to aid in the process of constructing and operating offshore wind farms for over 10 years. However, because each step of the process involves different contractors, datasets, and workflows, it’s difficult to ensure a smooth transition between every stage. For instance, specialized vessels are required to install turbine foundations, but the demand for these vessels can often exceed the number in service, impeding the construction process.
With a wide range of GIS tools including ArcGIS Dashboards, ArcGIS Pro, and ArcGIS Enterprise, Ørsted has been building a centralized GIS infrastructure called WindGIS that has enabled the company and its stakeholders to monitor every stage in the life cycle of Ørsted’s offshore wind farms, streamlining construction and providing stakeholders with geospatial information that allows the wind farms to operate effectively at every turn, from design to construction to operation.
Laying the Foundation
“In the construction phase, time is critical,” said Georgina Smith, senior GIS specialist at Ørsted. “One way we facilitate the fast review of data is through the use of a dashboard [created with ArcGIS Dashboards] to provide immediate insights to all stakeholders about key parameters of the cable installation. This reduces costly vessel time and helps us meet critical deadlines.”
Burying subsea cables helps minimize the risk of damage from anchoring ships or trawled fishing gear, as well as lowering the potential safety risk to mariners. This dashboard is used to monitor accuracy, progress, and how well a contractor has buried a cable beneath the seabed.
Data regarding each cable is provided by the contractor to Ørsted in one-meter spaced points in Excel format, which is loaded into ArcGIS Pro using a custom-built tool. The ModelBuilder and Field Calculator tools in ArcGIS Pro are then used for batch processing and inclusion in the geodatabase. The resulting geospatial points are published to the ArcGIS Enterprise portal for viewing on a dashboard. Specific sections of selected cables can then be examined for quality assurance purposes and feedback for the installation vessels.
“Laying cable correctly and efficiently is an important part of the entire construction process,” noted Smith.
But monitoring the construction process for these wind farms goes beyond burying cables, and right up to the foundation for the turbines themselves.
The foundation for each turbine is a monopile, a single structure that supports the entire load of the turbine. The angles where the cables meet the monopile foundations require precise calculation, since multiple holes need to be drilled into this foundation to install the array cables for each turbine. The angle of each hole is critical to the transmission of the electricity from the turbine because of the number of cables needed and the trenches in which they are buried. On top of this, each offshore field can contain up to 200 monopiles, further complicating the calculations and often leading to a congestion of buried cables.
“Previously, we had to manually calculate the angle for each hole,” said Smith. “Using a custom tool we developed with ArcGIS Pro, we can now input turbine and array cable layouts and output an Excel spreadsheet with the calculated angles. This has also helped bring uniformity to our process, so all angles are calculated in the same way.”
One Source of Truth
While each stage of the process—design, construction, operation, and maintenance—presents unique challenges when it comes to offshore wind farms, each stage also depends on the success of the others. This is why WindGIS monitors every step of the life of a wind farm, from cable installation to foundation construction and beyond.
“Our goal is to turn our ArcGIS Enterprise geodatabase into Ørsted’s one source of truth,” said Smith, meaning that every piece of data would be in one place for stakeholders to easily reference.
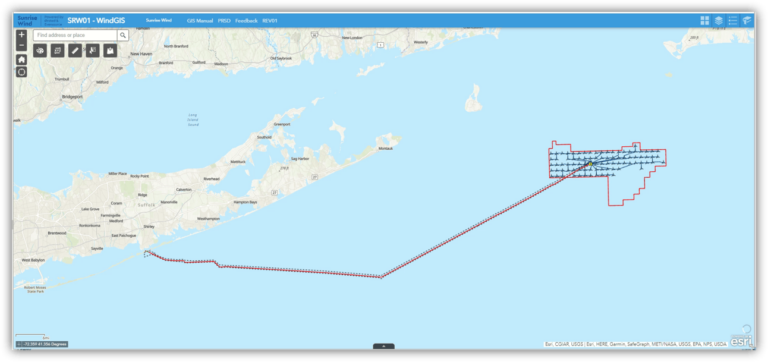
The platform also includes an online map within the Enterprise portal to provide core project infrastructure details that stakeholders can easily access themselves. The information available includes turbine layouts and cable routes, as well as constraints such as paleo landforms and potential munitions and explosives of concern. Third party services are included in the interface, such as the National Oceanic and Atmospheric Administration’s shipwreck layers and Nautical Chart Service.
Data available in WindGIS can be enhanced using the Add Data widget in ArcGIS Experience Builder. Microsoft’s Active Directory security groups are used to manage who can view a project and allows confidential data for special projects to have increased restrictions.
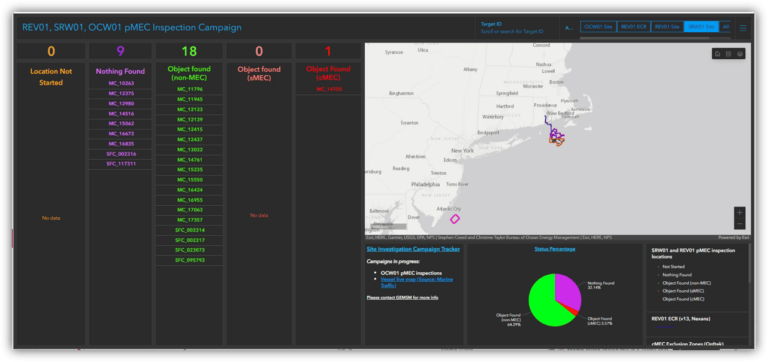
Additionally, a site investigation survey tracker dashboard displays live data from a survey vessel on the platform. This provides an overview of the inspection progress. It is used in stakeholder meetings to communicate inspection status within a geospatial context.
The centralization of all this data means that Ørsted’s wind farms can transition smoothly from design to operation with open lines of communication across the board. And Ørsted is continuing to improve its system, ensuring that every piece of data ends up in the same place, in the hands of stakeholders who need it.
“We are in the process of implementing a new data model that has a schema specifically designed to standardize and manage all of the data needed during the entire process of a wind farm’s life cycle,” said Smith. “This will help increase the number of GIS-based applications that we can provide to our internal stakeholders to assist their work and maintain a consistent dataflow across our entire project portfolio.”
