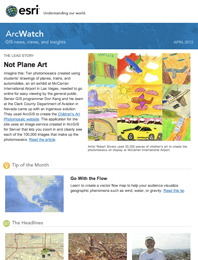
Mapmakers create vector flow maps to help their audience visualize geographic phenomena that change continuously and smoothly over space and time, such as wind, water, or gravity.
For example, the map below shows global wind patterns. Between about 30 degrees latitude and the equator, the cooling air of the trade winds moves toward the equator, while the rest of the air flows toward the poles. The Coriolis effect makes the trade winds appear to curve to the west, whether they are flowing toward the equator from the south or north. Between 30 and 60 degrees latitude, the winds that move toward the poles appear to curve to the east.

It’s important to distinguish these vectors in vector flow maps from GIS data in vector versus raster format. For vector flow maps, vectors are points at which information about direction and magnitude have been collected, for example, wind direction and wind speed, in meters per second. The points are arrayed, either regularly or irregularly, over an area. Together, the collection of vectors provides information about the direction and magnitude of some phenomena throughout the area.
You can symbolize vectors using a line segment whose orientation represents the direction information, with an arrowhead indicating the direction of flow. You can vary the line in either length or width to show the magnitude information.
You can use ArcGIS for Desktop to make a vector flow map using global wind vector data provided by the National Oceanic and Atmospheric Administration (NOAA). (This data includes wind direction and speed for the month of January calculated from the years 1981 to 2010.) For each point location, there is information about wind speed and direction, as shown in the view of the attribute table for the Wind Vectors feature class that was created from the NOAA data (figure 2).

There are two basic steps to making a vector flow map: first, symbolize the magnitude attribute using graduated (or proportional) symbols, and then symbolize the direction attribute using rotation.
Follow these instructions to create a vector flow map of wind speed:
Step 1: Symbolize the wind speed’s magnitude with symbol size so that vectors with higher speeds have larger symbols. In ArcMap, right-click the layer that contains the vector data in the table of contents and click Properties.
Step 2: On the Symbology tab, under Show, click Quantities > Graduated symbols (figure 3).

Step 3: Set the Value field to Speed. As noted earlier, this attribute has the magnitude information for the point data.
Step 4: Verify that the data is classified as you wish—in this case, with five classes using the Natural Breaks (Jenks) classification method.
Step 5: Change the symbol sizes to a range that works for your data—in this case, from 4 to 24 points.
Step 6: Click the Template button and, on the Symbol Selector dialog box, click Edit Symbol.
Step 7: On the Symbol Property Editor dialog box, make sure that Type is set to Character Marker Symbol and choose an arrow symbol that works for your data. In this instance, it’s an arrow symbol from the ESRI Cartography font (figure 4).

Note that the selected symbol is oriented so that it points up (toward geographic north).
Step 8: Click OK to close all dialog boxes and see the results (figure 5).

Step 9: To symbolize the wind’s direction by changing the rotation of the symbols, right-click the layer that contains the vector data in the table of contents and click Properties.
Step 10: On the Symbology tab, click Advanced > Rotation (figure 6).

Step 11: On the Rotate dialog box, click the down arrow for the field under Rotate Points by Angle in this and select the attribute that has the direction information.
Step 12: If necessary, change the rotation style from Geographic to Arithmetic if the data you are using rotates from the east in a counterclockwise direction rather than from north in a clockwise direction (figure 7).

Step 13: Click OK to close all dialog boxes and see the results (figure 8).

Your vector flow data should now be appropriately symbolized to show both the magnitude and direction of the phenomena.
Here are a couple of additional tips for mapping vector flow data:
- If you want to show the size of the arrows in direct proportion to the wind speed, use the Proportional symbols renderer, which also has an option to set rotation. See the online help to learn more about using proportional symbols.
- If your data uses neither geographic nor arithmetic rotation, you can add a new direction field and calculate the values using one of the formulas in the “Using rotation angles for marks, lines, or polygon fills” blog entry on ArcGIS Resources.
About the author