
“What kind of world do you want to see?” asked Esri president Jack Dangermond to kick off the Plenary Session for the 2023 Esri User Conference, held in San Diego, California, July 10–14.
The theme of the conference was Creating the World You Want to See, a sentiment weaved through the user presentations, technical demonstrations, Map Gallery displays, and special interest group meet-ups that took place during the week. It was also central to the user stories, GIS demonstrations, and keynote speeches of the Plenary Session presented on day one of the conference.
“The world that we live in today is a highly interdependent ecosystem,” continued Dangermond, addressing the nearly 18,000 in-person and 10,500 virtual attendees hailing from more than 130 countries. “And it’s changing; it’s evolving. Humans increasingly will play a major role in its future—people like you and me.”
Dangermond implored audience members to consider how their GIS work shapes this future, whether the goal is to create a world that is healthier, more sustainable, or more equitable. Few people, he noted, are in a position to understand the interconnectedness of the world’s challenges as clearly as GIS professionals.
Over the course of the Plenary Session, many of these GIS professionals had the chance to answer the central question of the day—What kind of world do you want to see?—with a vision for a more sustainable, efficient, and peaceful world. Government organizations, private companies, and educational institutions inspired the Plenary Session audience by demonstrating how they use GIS to take responsibility for the future.

These presentations were followed by two keynote speeches by National Geographic Explorer Dr. Steven Boyes—who spoke about his use of GIS to help conserve the Okavango Delta—and Dr. Richard W. Spinrad, undersecretary of commerce for oceans and atmosphere and the 11th administrator of the National Oceanic and Atmospheric Administration (NOAA), who educated the audience about the New Blue Economy, a knowledge-based economy that looks to the sea to find the information needed to address global challenges.
What all the presentations had in common was a clear, powerful vision of a better future, and a path toward creating a world they want to see.
Utility Keeps People Safe with Enterprise GIS
In the last decade, the Pacific Gas and Electric Company (PG&E)—which provides service to more than 16 million people across 70,000 square miles in California—has transformed its operations from a paper-based system to a mission-critical, enterprise-wide GIS.
The company has deployed enterprise GIS on reliable and scalable hardware, integrated its geospatial software with non-GIS enterprise systems, and made GIS accessible to PG&E’s 26,000-person workforce via an internal hub site called GeoHub. Elizabeth Proctor, principal GIS data program manager at PG&E, demonstrated the hub site, which was created with ArcGIS Hub.
“From here, all of our coworkers can get access to our enterprise applications, discover content specific to our functional areas, and access an authoritative GIS catalog of data,” Proctor said.
PG&E also developed its Electric Distribution GIS (EDGIS), which integrates GIS-based asset data with other critical business systems. It allows electrical engineers, for example, to see work orders from the company’s SAP system and plan projects that minimize customer inconvenience. It also enables field crews to see the layout of the electric network they’re working in.
“[This] not only helps us with regular maintenance, but it also is critical to helping us respond to real-time events that impact the safety of our communities,” said Dave Lewis, PG&E’s senior manager for GIS products and solutions.

PG&E has a 24/7 Hazard Awareness and Warning Center that brings together feeds such as weather warnings, outages, live camera footage, and real-time PG&E truck locations to help analysts monitor and manage critical events. PG&E also developed two portals to keep the public and partner agencies informed of power shutoffs during dangerous weather conditions.
The company has created a central repository as well for all its images, lidar, and videos to help employees remotely inspect substation assets.
“This was a total game changer,” said Hamilton Erridge, principal remote sensing data platform program manager at PG&E. “This year, we used the tool to inspect over 125 substations. We had expected to achieve about a 30 percent increase in productivity, but what we actually achieved was 150 percent.”
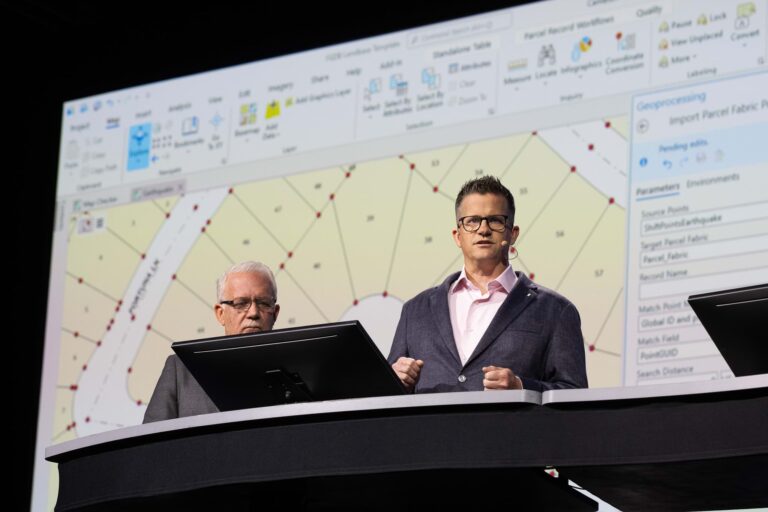
Orange County Showcases Three Decades of GIS Work
Orange County, California, has been working with GIS for a long time. After establishing its GIS control network in 1991, the county became an early leader in mapping technology and has continued in that vein since.
“The integration of surveying and GIS has led to our unique success,” said Kevin Hills, county surveyor for OC Public Works, who highlighted accomplishments such as a capital project portfolio dashboard and a registrar of voters dashboard.
With these tools, the county has consistently prioritized innovation in surveying and mapping. OC Survey, for instance, has embraced new techniques and technologies—including automation and artificial intelligence—to streamline workflows.
With 114,000 new parcels added to Orange County since the inception of its GIS department, the county has developed tools such as a self-service mapping review app that allows property maps to be uploaded, corrected, and sent to the GIS team.
“Surveyors are provided with real-time validation on their map submission to automate and expedite the map review, which leads to cost savings,” said Cameron Smith, GIS manager for OC Public Works.
OC Survey’s geospatial expertise came in handy when heavy rains led to a leak at John Wayne Airport. Having created a 3D digital twin of its terminals, the OC Survey team used ArcGIS Indoors to determine which assets would be impacted and formulate a plan to temporarily relocate them for repairs.
“We used [ArcGIS] Indoors to check out the floorplan,” said Marie Aquino, GIS specialist for OC Public Works. “Our floorplan was derived from BIM [building information modeling] and migrated into ArcGIS Indoors.”
With an aerial drone searching the roof for the source of the leak, the team was able to find and flag it for repair using drone imagery and ArcGIS Excalibur.
“In Orange County, we are constantly innovating,” said Smith.
Siting Locations for Electric Vehicle Charging Infrastructure
Electrify America has built the largest open, ultra-fast charging network in North America, with over 800 operating stations. Brandy Mathie, director of site acquisition and portfolio management at Electrify America, and her colleague Julie Wagner, Electrify America’s location strategy manager, gave the Plenary Session audience a look at how the company uses GIS to determine where to install new EV charging stations.
“We use data to understand where to focus our strategic efforts,” said Wagner. “Once we’ve identified our strategic metro areas, we want to look for where people live; where people buy EVs; where disadvantaged communities are, to ensure equitable access; and the National Electric Vehicle Infrastructure, or NEVI, highways that states have identified as part of the program, which [provides] federal funding to build EV charging infrastructure.”
Wagner showed how she takes those layers and enriches them in ArcGIS Business Analyst with additional data on traffic and retail businesses to perform suitability analyses. She can also use a program to automatically generate reports that indicate whether a site is appropriate based on strategic, financial, and real estate requirements.

She brought up a map of Palm Springs, California, that contained a few potential sites for EV charging stations. One was near two shopping centers, indicating great amenities, but finances were problematic. Wagner noticed, however, that the area was split into two utility districts. By simply moving the site from a shopping center in one utility district to a shopping center across the street in another utility district, she was able to bring the finance requirements down to an acceptable level. Electrify America then works with utility companies to ensure the appropriate power availability in an area.
“Building North America’s largest open, ultrafast charging network can’t be done alone,” Mathie concluded.
A Medical Facility Constructed with GIS
Every step of PCL Construction’s $1.7 billion project to build St. Paul’s Hospital in Vancouver, Canada, has been underpinned by GIS. A team from PCL walked the Plenary Session audience through the planning, construction, and operation of the site from a geospatial perspective.
As demonstrated by Lina Stinnett, senior integrated construction technology manager for PCL, one of the most significant aspects of the project has been employing Site Scan for ArcGIS to make decisions about site logistics.
“We’re able to push the envelope of construction and elevate it through accuracy and precision,” said Stinnett.
Drones are used to map the project site every week, allowing PCL to monitor progress with heatmaps and excavation analysis.
“As drone imagery is changing constantly, it serves as a living canvas we can literally draw on,” said Bilal Yasir, a PCL integrated construction technology specialist.
This picture of the site enabled the PCL team to avoid a conflict between an access ramp and the crane foundation, plan for the 550 cement trucks needed to pour the site’s foundation, and save on the costs of removing several large boulders found during the excavation phase.
“Everything fit like a jigsaw puzzle, with precision and accuracy,” said Yasir. “There was no hassle, no frustration, and no on-site coordination.”
Geospatial tools such as ArcGIS GeoBIM have also been central to preparing for the hospital’s operation. Providence Health, PCL’s client, requires specific BIM data to hit the ground running, explained Aaron Akehurst, senior integrated construction manager for PCL. Fortunately, the team can link the design and construction models to provide accurate asset locations, collecting this data as they build.
“The construction industry wants to be part of the digital future,” he said.

Inside Cambridge’s 3D Digital Twin
With more than 18,000 people per square mile, Cambridge, Massachusetts, is one of the most densely populated cities in the United States. With space at a premium, the city created a detailed 3D basemap, with many formerly 2D web maps—such as a neighborhood viewer—now available as 3D web scenes in ArcGIS Online.
Jeff Amero, GIS manager for the City of Cambridge, demonstrated the capabilities of this basemap with his colleague Katie Grillo, a GIS web technology specialist.
The basemap leverages Cambridge’s open data policy to make this information freely available for download. The goal is to engage the community by fielding public comments—about where to add crosswalks or stop signs, for example—that can be reviewed in a 3D mesh created with ArcGIS Reality. This enables city planners to prioritize areas that need urgent response.
Cambridge also uses its 3D basemap to analyze climate factors such as roof reflectivity and the health of the city’s tree canopy. The Cambridge Department of Public Works, for instance, leverages its urban forestry point layer to help maintain and preserve vegetation and plant new trees.
“We’re trying to mitigate urban heat and improve the quality of life in our city,” said Grillo. “[This requires] all members of our community to understand the importance of our collective urban forest.”
Another place this digital twin has been particularly useful is at the Massachusetts Institute of Technology (MIT). With 20 separate renovation projects and four ongoing capital projects, digital modeling is critical to maximizing the use of campus space, explained William P. Witts, Jr., manager of facility information systems at MIT.
“Being able to explore BIM models directly within our web scene allows us to answer questions about ongoing and future projects,” said Witts.
MIT also supplies these detailed models to the city so they can be maintained as part of a single, comprehensive 3D basemap of Cambridge in the future.
GIS Facilitates Proactive Threat Management
Aerospace and defense company Lockheed Martin has more than 120,000 employees located in 350 facilities in 40 different countries.
“Our greatest asset is our people, and we have a massive responsibility to ensure their safety and security,” said Amanda Haas, security systems senior manager at Lockheed Martin.
Nearly 10 years ago, Lockheed Martin began to evolve how its teams address hazards caused by severe weather, earthquakes, civil unrest, and more. The company developed the Global Emergency Operations Center (GEOC) to help analysts acquire information, share knowledge, and assist employees.
“Knowing where and when events are occurring across the globe can be overwhelming,” Haas pointed out.

The system takes risk events from multiple providers, including the National Weather Service and crisis-focused consulting firms, and joins those with company assets such as facilities, corporate travel data, and employee locations. If a risk event occurs near an asset, a threat is generated, and Lockheed Martin’s watch officers assess the alert.
“This system is a robust situational awareness tool that provides users with the resources needed to take action,” said Haas.
In April, the company ensured that 65 of its employees in the Netherlands were safe after a train derailment. And last year, watch officers used an app called Global Command Center—just two days after it launched—to bring in data from state and local government GIS departments and the National Hurricane Center to visualize the potential impact of Hurricane Ian to Lockheed Martin’s employees, facilities, and business operations.
“By using a geospatial tool integrated with company assets and near-real time risk data, we can be prepared to respond and act,” Haas said.
Building a Desert City from the Ground Up
Planning a city from scratch is no small task. That’s exactly what Foster + Partners (F+P) set out to do in Kuwait with South Sabah Al-Ahmad, a planned 24 square-mile development with a projected population of 280,000.
The priority is mobility and sustainability, according to Bruno Moser, F+P’s head of urban design.
“We build geography into our design process,” he said. “We need to understand the forces that shape our cities so we can make informed decisions when we design new projects.”
To start, the team at F+P used an algorithm for spatial hierarchy to analyze the benefits and drawbacks of city street layouts around the world and applied these principles to its design.
Using ArcGIS CityEngine, F+P was able to plan and map out the street network and land use, as well as export the 3D model to a web scene. The scene could then be embedded in an ArcGIS StoryMaps story to flesh out the plan for the client or exported to the Unreal game engine to model a real-time, photorealistic environment.

Planning the site in a virtual environment allowed the F+P team to consider and visualize every part of the future city, from the average height of buildings in its business district to the native vegetation planted in parks. Connectivity analysis even allowed the team to ensure that all residents could live within 400 meters of a green space.
“The design process is a collaboration between multiple design professionals,” said Dr. Mateo Neira, associate data scientist at F+P. “[We’re] bringing together all the elements needed to create a city that will respond to the needs of the people that will live here in the future.”
Documenting War Crimes Remotely
As Russia’s military forces built up along Ukraine’s border—just before Russia’s full-scale invasion on February 24, 2022—the US Department of State’s Bureau of Conflict and Stabilization Operations (CSO) convened conflict analysts and Ukraine experts.
“CSO’s mission is to anticipate what might occur and devise strategies to rapidly respond to crisis situations,” said Dr. Susan Wolfinbarger, CSO’s bureau chief geospatial information officer. “We knew that Russia’s brutal, full-scale invasion would lead to the unfortunate need for atrocity documentation.”
Wolfinbarger immediately put her brainchild—the Conflict Observatory—into operation. The program is composed of nearly 70 subject matter and technical experts, including Yale University’s Humanitarian Research Lab, the Smithsonian Cultural Rescue Initiative, and Esri. The Conflict Observatory relies on spatial data sources and open-source investigation techniques to document war crimes in a way that is admissible as evidence in justice and accountability procedures.

Wolfinbarger showed the audience a dashboard that displays war crimes and other abuses across Ukraine. When the Organization for Security and Co-operation in Europe called for documentation support shortly after the invasion began, Yale responded rapidly with a report that focused on atrocities committed at medical facilities, which are almost never legitimate targets of war. One point on the dashboard showed a hospital in Mariupol that had evidence of artillery shelling and other damage.
The Conflict Observatory is also monitoring potential damage to Ukraine’s 28,000 cultural heritage sites, as well as Russia’s abuses against Ukrainian civilians. The team’s documentation of Russia’s illegal relocation of thousands of Ukrainian children led to the International Criminal Court issuing arrest warrants for Russian president Vladimir Putin and his children’s rights commissioner, Maria Lvova-Belova.
While the Conflict Observatory was created in response to the invasion of Ukraine, CSO can deploy it anywhere. When fighting broke out in Sudan this past April, Wolfinbarger and her team put it to service there to document threats to human security and critical supplies.
“With the Conflict Observatory, we can tackle problems from multiple angles,” Wolfinbarger said.
Afterward, the National Geographic Society’s chief education officer, Dr. Deborah R. Grayson, took the stage to laud the benefits of National Geographic MapMaker, an app designed to facilitate geographic curiosity in the classroom. Grayson was joined onstage by three sixth-grade students from Foulks Ranch Elementary School in Northern California, who demonstrated some of MapMaker’s features.
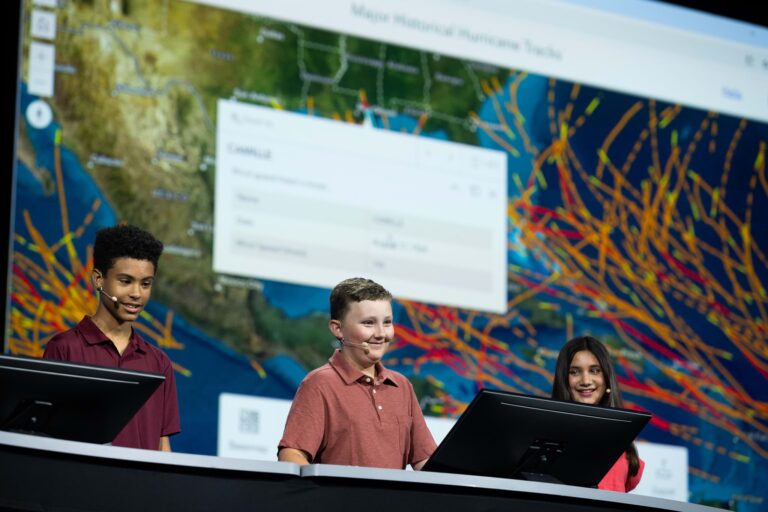
“I invite each of you to [promote] these resources in your own programs, communities, and classrooms,” Grayson encouraged the audience. “Together we can make a real impact and help inspire the explorer in everyone.”
Watch all Plenary Session presentations, including the keynote speeches, on this page.