GIS is not just a science—it’s the story of how and where we live, and the decisions we make based on geospatial information. Too often, however, this data can feel distant from the personal experience of visiting or living in a place with its own geography and design—factors that have a tangible effect on productivity and well-being.
Dr. Christine Wacta, a professor of interior design at Georgia Southern University (GSU), is working to bring this human-centered mindset to the world of GIS, ensuring that people’s lived experience becomes part of geographic and data-driven design solutions.
“At Georgia Southern University, GIS software was only used in the geography department, and lacked a human-centered focus,” said Wacta. “We generate more data than we know what to do with—but this data often omits cultural, religious, or personal responses to an environment.”
It is to put the focus on the benefits of this information that Wacta has developed a geospatially integrated design approach in her human-centered design course for first-year undergraduate students at GSU.
At the core of the class—as well as Wacta’s philosophy of design—is the idea that spaces should be designed with individuals in mind, that people’s experiences and emotions are intertwined with the environment and therefore cannot and should not be separated. In the classroom, Wacta uses a blend of geospatial technologies such as ArcGIS StoryMaps, ArcGIS QuickCapture, and ArcGIS Survey123 to bring GIS and human emotions together.
“What we’re doing is transposing interior design onto urban design,” said Wacta. “Urban design is just a megasized version of interior design. Jane Jacobs said, ‘There is no logic that can be superimposed on the city; people make it, and it is to them, not buildings, that we must fit our plans.’ The same applies to buildings in interior design.”
By introducing GIS tools to her interior design students, Wacta hopes to help them understand the effects of environments on individuals—and how individual responses can inform decision-making at all scales.
In and Out of the Classroom
The goal of students in the human-centered design course is to create an app that evaluates a space from a human-centered perspective, based on the Urban Emotions app Wacta developed using ArcGIS QuickCapture.
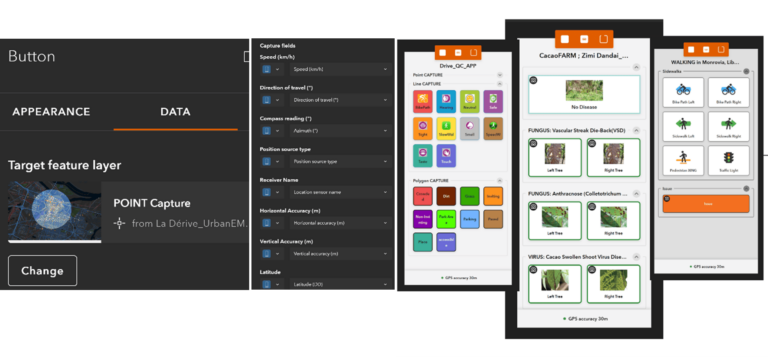
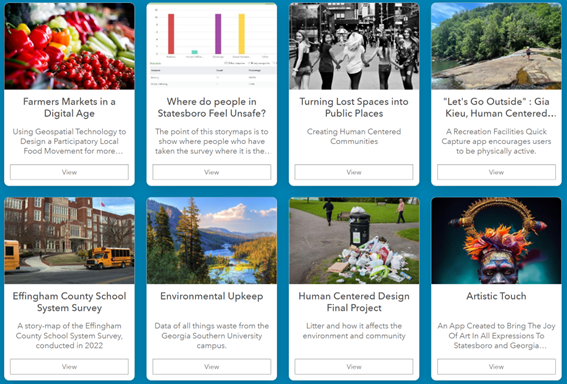
The student-created apps aim to put experiences and emotions front and center by collecting information about how people respond to physical spaces, and how those spaces can better serve the needs of those who occupy or visit them. They are collected in a site created with ArcGIS Hubs for the Geospatial Student Chapter, a student organization at GSU that Wacta advises.
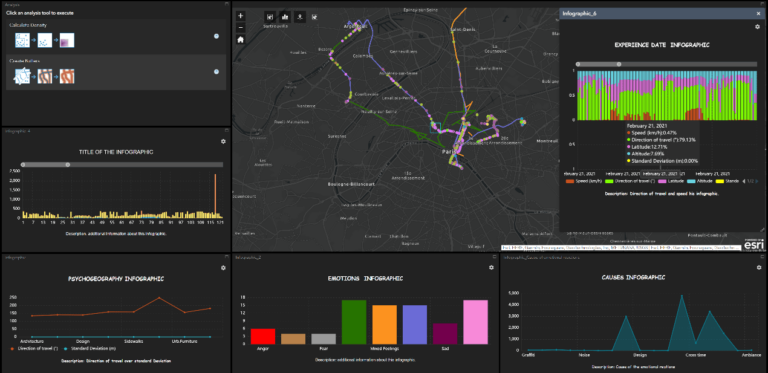
In preparation, Wacta assigns activities on collecting and understanding data with ArcGIS Dashboards. Her students become familiar not only with the process of data collection, but also with the world of ArcGIS.
Students begin their projects by interviewing 10 individual people using ArcGIS Survey123 and ArcGIS QuickCapture. They create questions, collect data, and summarize any findings about their chosen subject in a story created with ArcGIS StoryMaps. Topics run the gamut from school bullying to campus safety to gentrification.
Kya Dickson, a student in Wacta’s fall 2022 course and president of GSU’s Geospatial Student Chapter, chose to tackle farmers markets. She wanted to examine the accessibility of local or fresh food to the residents of a given area, and wondered if the design of a farmers market might make the environment more or less accessible to residents.
Dickson began by interviewing friends, family, coworkers, and farmers market vendors about their experiences. She then asked them to visit a local market and use her app developed with ArcGIS QuickCapture to capture features and emotions found and experienced in farmers markets.
“The range of what people noticed in a farmers market surprised me,” said Dickson. “What they wanted or didn’t want.”
Dickson then used ArcGIS Community Analyst to compare her survey results with data such as demographics, income, and proximity to grocery stores.
“The Community Analyst feature surprised me,” said Dickson. “There was so much information we could access through that platform. I was surprised that the amount of information is out there for a student like me to get a hold of and use for a project.”
In one area, Dickson found, the local farmers market was surrounded by a large Hispanic community, but analysis showed that the populations nearest to the market did not tend to buy local or organic foods. Dickson concluded that this could result from a lack of knowledge of or access to local or organic foods in the area.
After synthesizing the different types of information she had gathered, Dickson presented her findings in a story created with ArcGIS StoryMaps, including a design for a more equitable, accessible version of a community farmers market.
A Well of Knowledge
Whether the students choose to focus on farmers markets or topics like exercise locations or college choice, they come away from the course with a better understanding of not only design, but also how to collect and interpret data.
“Students in this class displayed critical thinking that surpassed that of many graduate-level students,” said Wacta. “GIS is a teaching tool that allows me to be hands-off. Students take it to a whole new level and develop processes that result in solutions I never thought possible at that level. I learned as much as they did.”
Furthermore, it’s easy to see how this information might help community organizations or local governments implement policies that could impact people’s daily lives.
To illustrate this point, Wacta cited a project analyzing gentrification in Savannah, Georgia. An influx of money to the area has led to new construction and expanding businesses. But this economic development doesn’t always reflect the fact that, when surveyed, many residents proved uneasy about the changes their city was undergoing.
“If we start collecting this data from people, we can actually start making people-centric environments,” said Wacta. “How is an environment positively or negatively affecting users? What do people really want?”
Apps like the ones the students in this course create can leverage the issue by allowing all people to make their voices heard. Contributing their perspective through surveys and apps with a human-centered approach in mind allows residents of an area to feel that they have a voice, Wacta noted. Additionally, these tools have allowed Wacta and her students to learn about different locational contexts, and what residents need in various places.
“I hope that conducting these classes with students from all over, and doing it over and over, will allow us to push out apps and make them public, so people can start using them every day,” said Wacta.
ArcGIS StoryMaps, too, allows different kinds of data to be presented together in a way that tells a complete story to policy makers, making it a perfect tool for these types of human-centered projects.
“It’s really this well of knowledge that we’re building,” said Wacta. “The more we use it, the more value it gains.”
Learn more about the Geospatial Student Chapter at GSU.