“This is outstanding.”
That was what GIS analyst Lauri Sohl of Sioux Falls, South Dakota, recalls thinking when she first saw the rollout of the Urban Observatory exhibit and website at the 2013 Esri User Conference. She found it informative and fun to compare three cities side by side, studying data such as open space, commercial and industrial land use, and youth population. She wondered, ‘How could this help decision makers and citizens make informed decisions and learn more about our community?’
But all the cities in the exhibit and app were metropolises like Paris, New York, and Tokyo. The city where Sohl works and lives was missing from the screen. “I wanted to be a part of it. I wanted to see more communities the size of Sioux Falls up there, too,” she said.
This year, Sohl’s wish came true after she stepped forward with data for her city. So when people scrolled through the cities on the new Urban Observatory app’s interface at this year’s conference, there was Sioux Falls, population 164,676, right there between Singapore and Sydney, Australia.

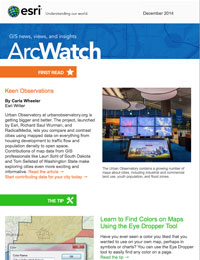
A growing number of communities of all sizes are answering a call from Esri, architect and TED conference cofounder Richard Saul Wurman, and RadicalMedia to contribute map data to the Urban Observatory. The mapping project, originally conceived by Wurman and now powered by Esri’s ArcGIS Online technology, currently includes 60 cities as diverse as Warsaw, Poland; Fresno, California; and Cairo, Egypt. Its goal? To get communities to think more about the consequences of urbanization and how to grow smartly in the future.
Wurman has said he hopes there will be more than 100 cities in the Urban Observatory when it opens at the Smithsonian Institution, an exhibit planned for 2015.
The app provides a platform for comparing one map subject for up to three cities at the same time. Patterns of population density, open space, new development, road speed, traffic conditions, flood zones, and 19 other datasets can be displayed on the map.
“This is trying to create a standard language so that one city can understand themselves next to another—understand successes and failures and the actions they take,” Wurman said in an interview with Bloomberg TV.

The Urban Observatory now includes a mix of cities with populations ranging from under 250,000—like Sioux Falls, South Dakota; Dubuque, Iowa; and Yakima, Washington—to more than four million such as Kolkata, India; Lagos, Nigeria; and Rio de Janeiro, Brazil.
There are many good reasons for GIS professionals to join those cities and add their city’s data, said Jim Herries, an Esri product engineer for cartography who works on the Urban Observatory project.
“A city that joins the Urban Observatory turns data into useful information,” Herries said. “Every city can see itself more clearly, one subject at a time. The maps paint the structures and land use patterns of your city in a more clear light. To a GIS analyst or manager, these maps seem simple, but to an executive or community leader, these maps are starting points for conversations. A city’s GIS data and maps should be sparking conversations about open space, transportation, jobs, and quality of life.”
Click Here to Contribute
To make contributing maps easy, the Urban Observatory website now includes a Get Involved link. When you provide your name, organization, and e-mail, the Urban Observatory team will reply with step-by-step instructions on how to create the maps and deliver them as map packages to the Urban Observatory Curator Group. (Watch the video to learn more.)

Sohl used the data loading tools to create and send in her Sioux Falls maps. Ditto for Tom Sellsted, a supervising senior analyst for the city of Yakima, Washington, who recently added data for Yakima County, population 247,000.
Sellsted said he hesitated a long time before contributing the maps. “It seemed to be a big city tool,” he said.
He also thought the process might be too time consuming and the data for Yakima County (an “apple capital” and emerging wine and craft beer region) might not contrast well with other communities.
“I was completely wrong!” said Sellsted. He said the instructions on how to create a map package included a starter project with a sample map. It took him less than six hours to assemble the data and create the map packages. While some data massaging was involved, the overall process went smoothly, according to Sellsted.

“The instructions were very straightforward and easy to follow. The data was readily available,” he said. “In many cases pertaining to land use and population, the steps were familiar after doing the first map package for that category. Publishing the map packages [on ArcGIS Online] was also very straightforward. They couldn’t make it too much simpler.”
The Yakima County data that Sellsted contributed included commercial and industrial land use, airports, railroads, population and housing density, youth and senior populations, and open space. In return, the Urban Observatory team created some maps for Yakima including predominate occupations, current temperatures, imagery, current winds, flood zones, traffic, impaired water, highway access, road speed, health resources, and environmental noise.
Sohl also found that the process of contributing her city’s data—including commercial and industrial land use, railways, airports, and open space—was straightforward and took less than a day. Other GIS professionals shouldn’t worry that the task will be arduous, she said. “It’s an extremely simple process if you know your data,” Sohl said.

After you submit the data, your city’s maps will go up on the Urban Observatory in short order. All the maps from Yakima and Sioux Falls were up and running on the app within 48 hours after the contributions were made, said Shane Matthews, Esri cartographic specialist and a member of the ArcGIS content team.
“Leonardo da Vinci once said that ‘Simplicity is the ultimate form of sophistication.’ Keeping map creation and participation simple is one of the Urban Observatory’s core philosophies,” Matthews said. “We have shared a set of easy-to-use tools that allow any city, or anyone representing a city, to produce a simple but powerful map from existing data. The ArcGIS platform makes all this possible and makes it easy for cities to participate.”
Comparing Apples to Apples
Sohl and Sellsted are both GIS “doers.” They follow innovations in their field, and they like to participate in projects that involve the GIS community. Their city governments also support data sharing.
Both also believe in the power of maps to help citizens and decision makers better understand issues.
Because the maps are presented at the same scale, you can compare apples to apples, Sellsted said. “You can do very visual comparisons,” he said, adding that he noticed how Yakima’s industrial areas seem to sprawl out more than in some other communities. “Does that mean they are planning better or are we classifying land use a little more broadly? All it does is beg more questions?”

Sellsted said city staff can use the app to dig into the data and study it. And hopefully, seeing Yakima in the Urban Observatory will give other communities of a similar size the impetus to join. “This is a very exciting tool, which should assist our elected officials and policy makers in understanding our community a bit better,” he said. “I would encourage other cities of any size to participate.”
For Sioux Falls, the app will be more powerful and the mapped data will have more meaning when more small- and medium-sized cities and those with a similar geography get involved, said Sohl. “I am calling on other cities [to join]. Where’s Des Moines? Where’s Lincoln [Nebraska]? Where’s Denver? Where’s Fargo?”
Sohl did some comparative analysis with the app, looking at how Sioux Falls’ flood zones contrasted with those of Dubuque, Iowa, and Chicago, Illinois. “(Chicago) borders Lake Michigan, yet they have relatively few flood zone areas. I wouldn’t have expected that,” she said. “We are more like Dubuque.”
Sellsted and Sohl also said the mapping app gives communities another tool in the toolbox to use to study a wide range of data such as population and housing density, open space, industrial and commercial land use, traffic flow, highway access, youth and senior populations, and health resources. “My community development director and [staff]—they love it. They are absolutely thrilled with it,” Sellsted said.
As a GIS professional, Sohl finds working with the app fascinating and worthwhile. She thinks that it will also appeal to the general public when it goes on exhibit at the Smithsonian Institution. “It is definitely addictive,” Sohl said. “It gives you a different perspective of a place you think you know. I appreciate tools that provide a visual representation in its simplest form, enabling all users to have a deeper understanding of our community.”
Read tips on how to Fast-Track Your City into the Urban Observatory in a Few Hours.