Every year, 48 million people in the US are sickened by foodborne illnesses caused by bacteria, viruses, or parasites, according to estimates from the Centers for Disease Control and Prevention. Of those, about 128,000 cases will be severe enough to lead to hospitalization. Sadly 3,000 of those cases will result in death.
Statistics like these are familiar for Brandon Adcock, senior environmental scientist for the Emergency Response Unit of the California Department of Public Health’s Food and Drug Branch. He and his unit investigate foodborne illness outbreaks across the state while collaborating with other state teams to make sure that California’s food and food products are safe for consumption. The job that Adcock helps shoulder has serious implications at a scale reaching far beyond the borders of his home state.
From the get-go, maps played a substantial role in Adcock’s work. He and his unit would make maps—mostly hand sketches—to aid in their investigations. They even had some handheld GPS units that he remembers as being outdated. But the tools they used could only do so much. There wasn’t an organized GIS system for the geospatial data his unit would collect. Even if there had been, no one had enough time to make full use of it.
Adcock joined the California Department of Health with no formal GIS training, and though he was familiar with the concept of GIS, his knowledge was limited. Adcock began experimenting with ArcGIS software between projects. He wanted to see what more could be done with the investigation data they were collecting that could help prevent future outbreaks.
“I made maps and analyzed whatever I could get my hands on and had the time to work with,” he said. “Simple things, like putting a rectangle area on a map and using hillshade basemap to see drainage patterns or using the data from our GPS cameras to put points on a map of interesting observations.”
Adcock was driven by the knowledge that GIS could enable new, more powerful ways of achieving food safety.
“All I knew was GIS data and maps were helping make better decisions and ultimately protect public health and prevent illness,” he said. “I just kept going and learning more as I could.”
Adcock began by taking advantage of the many training resources offered by Esri, including remote, instructor-led classes; ArcGIS web courses; and massive open online courses (MOOCs). The low barriers to entry and flexible schedules of these offerings allowed Adcock to study topics he might not have been able to otherwise explore, such as building geodatabases, data analysis techniques, and cartography
“To this day I refer to [these resources], and they have become a staple of my GIS reference library,” he noted.
One of the most important resources Adcock was introduced to was Esri Community—an online space where ArcGIS users around the world can explore GIS ideas and solutions. Not only did it help him navigate the ins and outs of ArcGIS technology as he explored other Esri training options, but it also connected him with other GIS learners and professionals eager to share their knowledge and experience.
“The Esri Community has been my primary source of training for GIS work,” said Adcock. “I know I can always go in there. I can put in a question and I will get an answer.”
Making the Case for GIS
Although GIS has long been integral to the field of public health, Adcock faced more than one uphill climb in the pursuit to get the value of modern ArcGIS software recognized in his workplace. Not only did his mission have to fit in piecemeal around his regular work investigating outbreaks, but he was also attempting to learn tools like ArcGIS Pro and ArcGIS Dashboards without the benefit of a formal GIS education or local mentors who could offer guidance. If Adcock could manage to clear both of those obstacles, he’d need to convince others to help make his vision a reality.
As his familiarity with ArcGIS software grew, Adcock began evangelizing about the benefits he was uncovering. He’d engage everyone he could—managers, co-workers, federal partners—that GIS could provide valuable insights beyond what was possible with their usual tabular data and written reports.
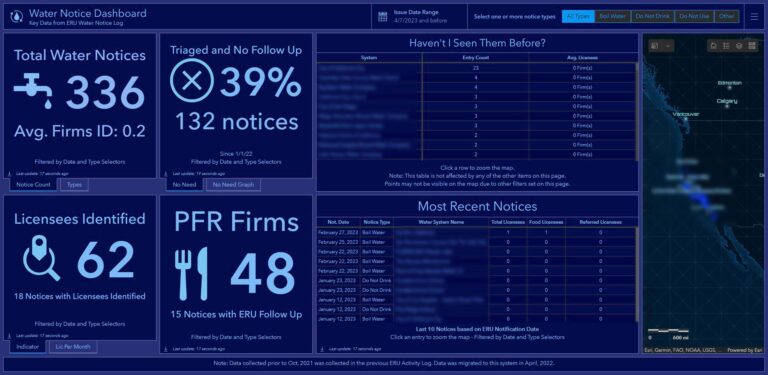
For instance, Adcock was able to create a dashboard with ArcGIS Dashboards that allowed his unit to track statistics for public water system notices. Any time a public water system encountered a water quality issue, Adcock’s unit was notified. They could then alert food, drug, or other licensees in the affected area to assess any food safety concerns.
With several successful GIS initiatives under his belt, Adcock persuaded his managers to create a new position within his unit that remained immersed in outbreaks and food contamination events, but with an explicit focus on data collection systems and GIS.
In 2019, seven years into his work with the State of California, Adcock was promoted to his current role, where he analyzes outbreaks and food contamination from a spatial perspective while continuing to improve the Emergency Response Unit’s digital data collection and visualization with tools like ArcGIS Survey123 and ArcGIS Dashboards.
His confidence in the importance of ArcGIS in his work—and in the importance of a collaborative approach to learning GIS—has only grown with time.
“Maps, surveys, and dashboards are powerful tools that need dedicated attention to help us in our mission to prevent illnesses in Californians and all people who eat food from California,” he said.
An Always Present Community
Having successfully earned a role for himself administering GIS, Adcock still regularly turns to the greater community of GIS peers and professionals who frequent Esri Community.
Adcock recalled a recent instance in which he found himself struggling with a monster of his own making. He’d cobbled together a process that allowed him to download and file photos from an online feature service in ArcGIS Survey123. Adcock would move and rename photos of every sample his unit collected during outbreak events. This could easily include hundreds of photos and had to be repeated every time new samples were gathered. Manually, it could take hours to complete.
Using the process he designed, the work could be done faster, but its complexity and the number of steps involved meant that it was still burdensome—never working quite the same way twice.
“It was a Frankenstein of a process,” Adcock noted. “But I was able to go on to the Esri Community. I asked if anyone else had this.”
A little searching revealed what Adcock was after: an openly shared Python script. Using that script as the framework for a slightly modified ArcGIS Pro task, he was able to construct a more efficient process that met his needs while simplifying procedures for others involved.
As Adcock and the team at the California Department of Health persist in their important work of preventing and responding to foodborne illness, Adcock is reassured by the knowledge that Esri Community and the support of his GIS peers found there will be a continual aid when needed.
“No matter how specific or complex,” said Adcock, “I know I’ll get the answer I need.”
