Conduct the Analysis with ArcGIS Online and ArcGIS Living Atlas of the World
If you have ever felt an earthquake, you likely wondered, How many other people felt it or were affected by it? And just how intense was the quake? Questions like this can be answered using some analysis tools in ArcGIS Online and content from ArcGIS Living Atlas of the World.
In this tip, you will determine the total population that is within proximity of an earthquake with measured shake intensity. Note that appropriate privileges are required to use analysis tools to complete the tip. This will be the workflow you will follow:
- Use ArcGIS Living Atlas of the World to create a recent earthquake map.
- Identify a quake event for the analysis.
- Filter the intensity layer to use only areas where the intensity is 4 or greater.
- Dissolve the boundaries to determine the total population impacted.
- Enrich the dissolved polygon with population data.
- Finalize the map and display the results.
Make a Map of Recent Earthquakes
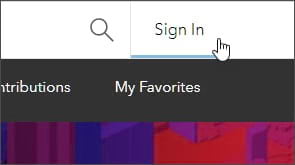
Step 1: Go to the ArcGIS Living Atlas of the World website and sign in using your ArcGIS organizational account.
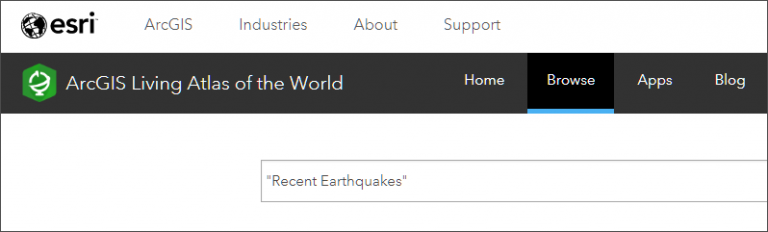
Step 2: Open the Browse tab and enter “recent earthquakes” in search.
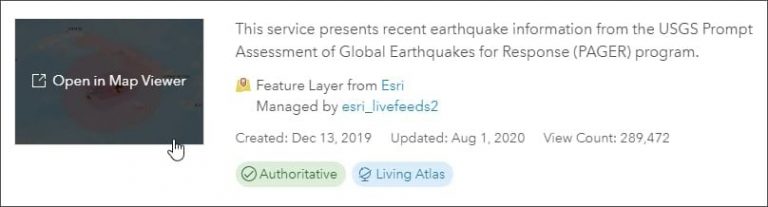
Step 3: Locate the Recent Earthquakes feature layer and click the thumbnail or title to open the item details.
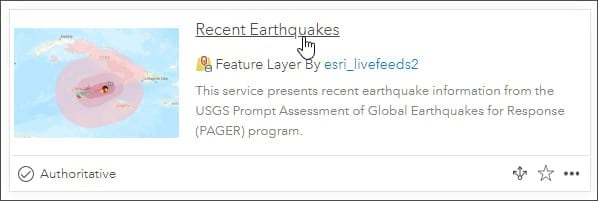
In the Recent Earthquakes item details, you will see that quakes are displayed by magnitude along with impact information. Events are updated as frequently as every five minutes and are available up to 30 days, except for events of magnitude less than 3.0 (retained 3 days) and events of magnitude less than 4.5 (retained 7 days). Labeled quakes are those with a PAGER alert, a measure of the scope and impact of the event.
Step 4: Open the layer in a new map. Save the map for future use.
Locate a Quake Event for Analysis
Step 5: Explore the map to find an area of interest. As you explore the map, click features to learn more about them.
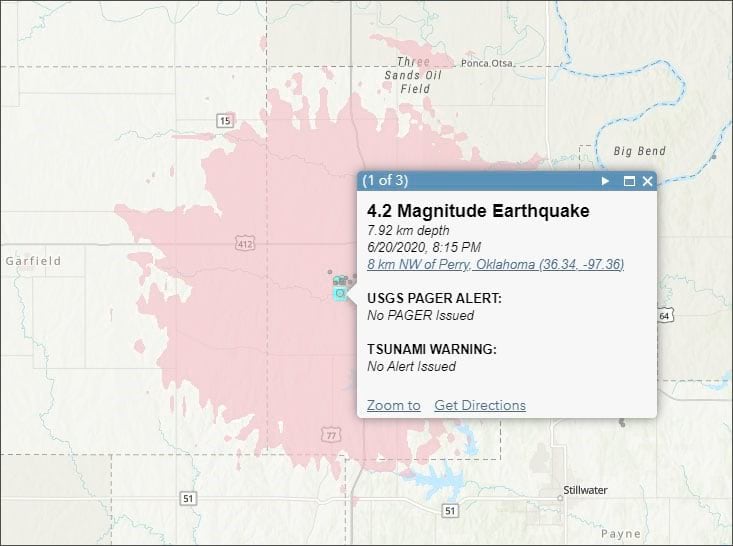
The Events by Magnitude layer pop-up displays the magnitude, depth, date, time, and PAGER alert status, and it includes a link to the US Geological Survey (USGS) event details.

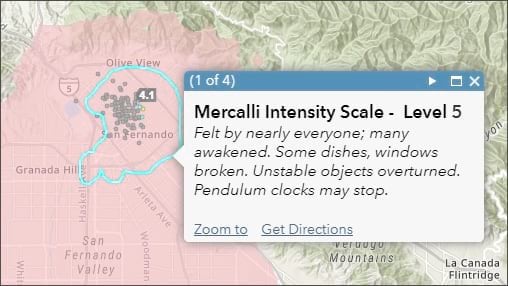
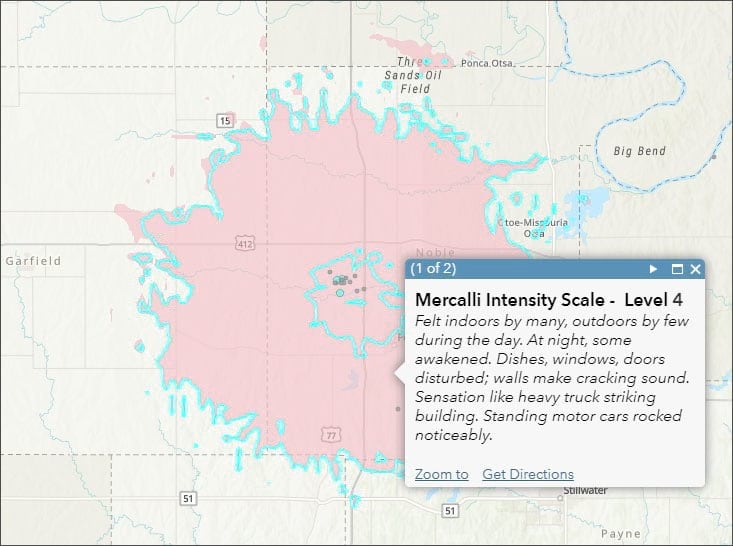
The Shake Intensity layer pop-up displays the Mercalli Intensity Scale and a description of what was felt and any expected damage.
An earthquake that occurred near Perry, Oklahoma, was chosen for the analysis.
Filter the Shake Intensity
Apply a filter to the Shake Intensity layer to show areas with an intensity of a 4 or greater on the Modified Mercalli Intensity Scale, eliminating the lesser intensities where the quake is less likely to have been felt or cause damage. Learn more about the Modified Mercalli Intensity Scale, which the USGS says is more meaningful to laypeople as a measure of severity than magnitude.
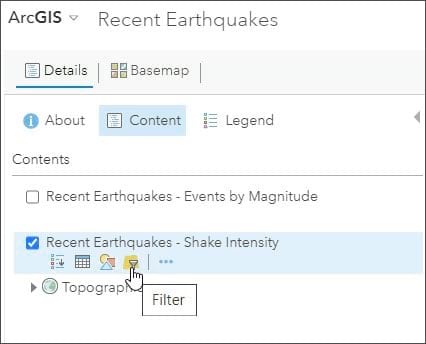
Step 6: Open the Shake Intensity layer filter.
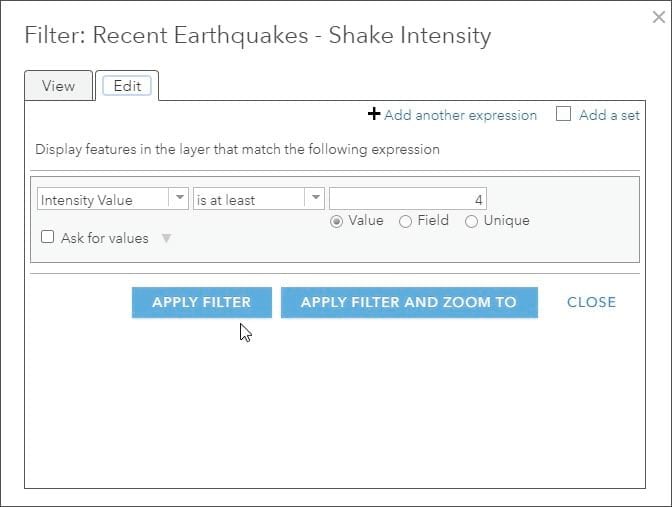
Step 7: Create a filter expression.
Expressions use the general form of <Field_name> <Operator> <Value, Field or Unique>. Use the drop-down menus to create the desired filter, in this case Intensity Value is at least 4. When finished, apply the filter.
Dissolve the Boundaries
Step 8: Since there may be overlapping or disconnected polygons matching the expression, dissolve the layer to create a single, multipart polygon for additional analysis.
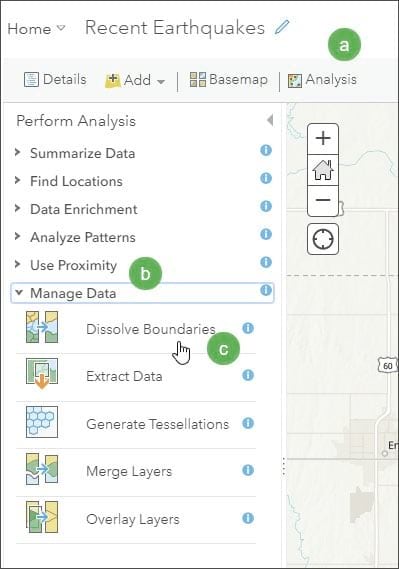
a. Click Analysis.
b. Open the Manage Data group.
c. Select Dissolve Boundaries.
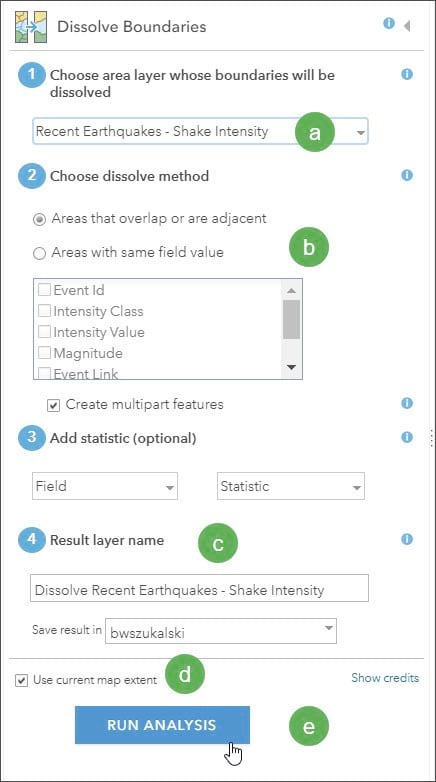
Step 9: Enter the Dissolve Boundaries tool parameters.
a. Select the Shake Intensity layer.
b. Accept the defaults to create multipart features.
c. Enter the layer name for the result.
d. Ensure that you have zoomed to the extent of the earthquake of interest and check Use current map extent. Since we are not interested in other earthquakes, this limits the analysis to this particular event and minimizes credit consumption for the analysis.
d. Click RUN ANALYSIS to perform the analysis.
The result of Dissolve Boundaries is a single layer with a single multipart polygon. Click the polygon to view the aggregated area.
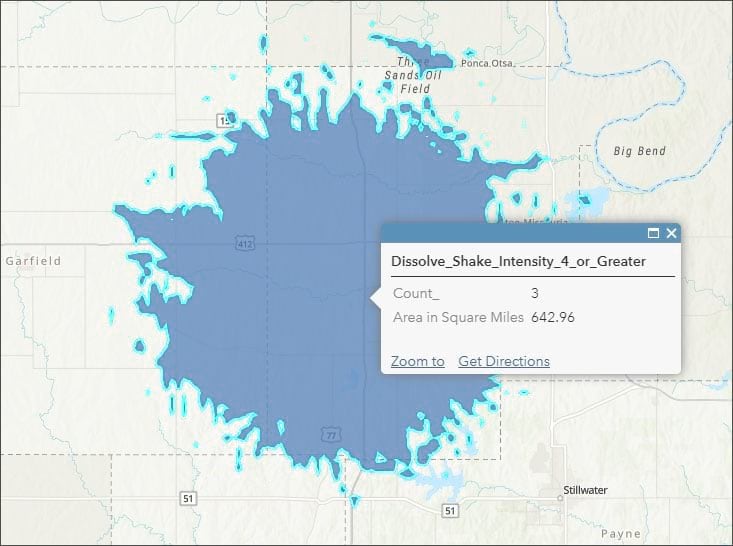
This new layer can be used for further analysis. In the next steps, the layer will be enriched to determine the number of people that experienced an intensity level of 4 or greater.
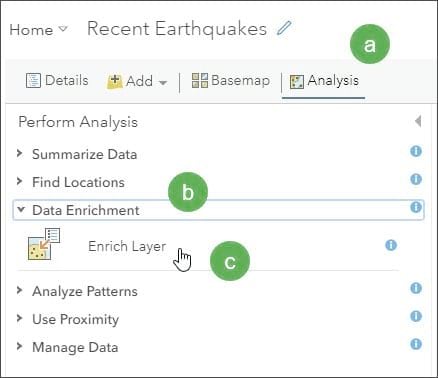
Step 10: Enrich the layer.
a. Click Analysis.
b. Open the Data Enrichment group.
c. Select Enrich Layer.
Step 11: Enter the Enrich Layer parameters.
a. Select the dissolved Shake Intensity layer from Step 8.
b. Click SELECT VARIABLES.
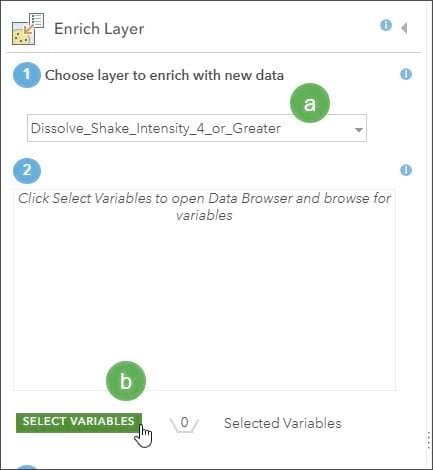
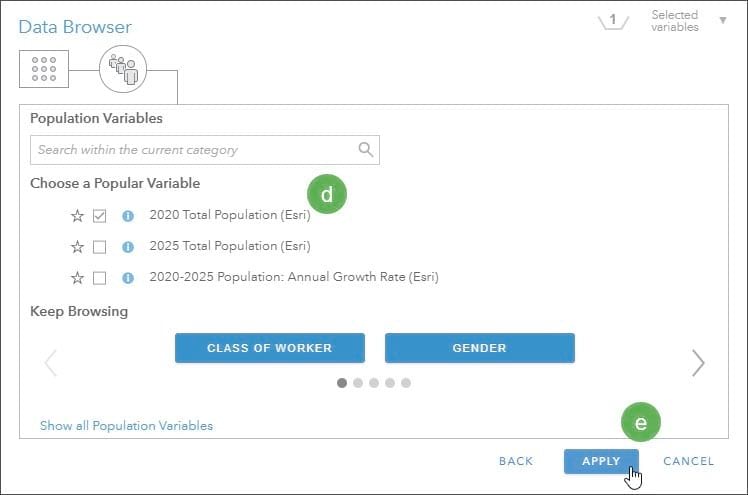
This opens the Enrich Layer Data Browser.
c. Select the Population data category.
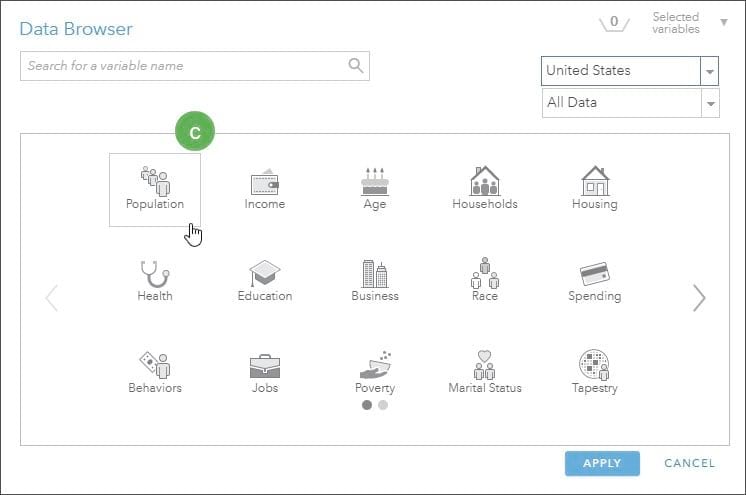
Next, choose the variables that you want to apply.
d. Check 2020 Total Population (Esri).
e. Click APPLY.
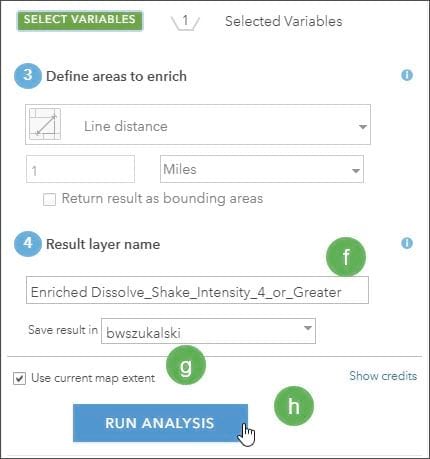
Complete other Enrich Layer parameters by entering the following:
f. Output layer name.
g. Use the current map extent, since we only want to apply the analysis to the current polygon.
h. Click RUN ANALYSIS to apply the selections.
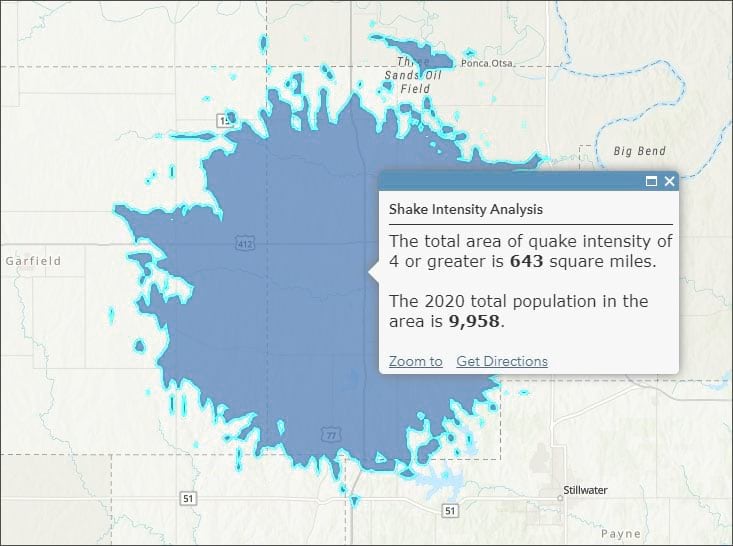
The enriched polygon now includes 2020 population counts. The image below shows a configured pop-up for the result showing the size in square miles and the 2020 total population within the polygon. To learn how to properly configure your pop-up, read Pop-ups: the essentials.
For more information, see the following: