If you’ve seen an Esri story map that presents a tour with a map and associated images, such as this Palm Springs Map Tour, and wondered how to make your own, then this tip is for you! All you will need is an ArcGIS Online account, access to a web server, a simple graphics program, Microsoft Excel or a text editor, and (optionally) ArcGIS for Desktop.
The Storytelling Map Tour template is one of the free templates Esri provides for creating story maps. This tip shows you how to create a map tour story map by downloading the template Esri provides, creating a web map using ArcGIS Online for your tour, and then configuring the template to display your web map. It’s easier than you think!
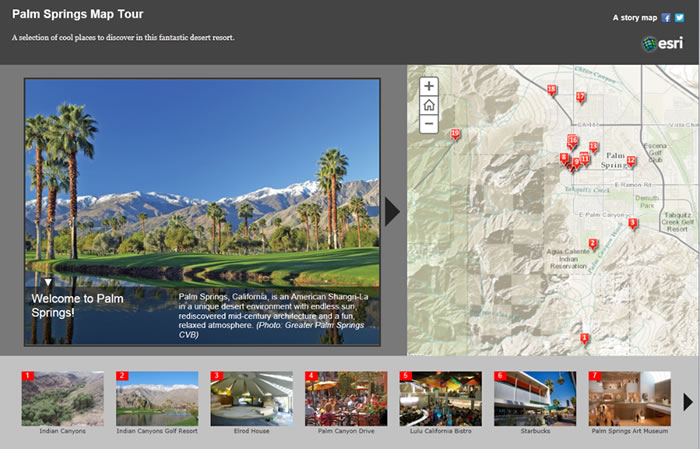
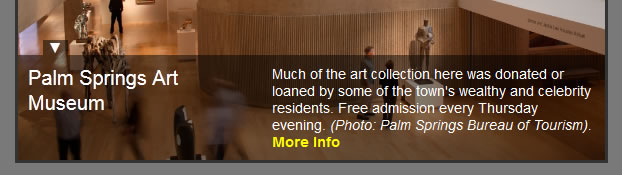
The map tour template lets people explore an area by stepping through a sequence of large photos with captions. Pictured here is the Palm Springs Map Tour.
Step 1—Come up with your tour idea
The Storytelling Map Tour template is designed for presenting geographic information where there is a compelling photographic element to the story you want to tell. Be creative! Here are some potential uses. Click to see an example of each:
- Promote an initiative like sustainability or redevelopment.
- Promote a place and help people find interesting things.
- Reveal the history, culture, or ecology of a place.
- Highlight something distinctive and compelling about your neighborhood, city, or region.
- Educate people about science and geography.
- Illustrate a really great walking tour route.
- Anything else you like!
Step 2—Install the template
Download the ZIP file containing the map tour template. Unzip this file and copy the contents into a new folder in the file structure of an existing website or web server that you have access to so that the folder is publicly accessible to users on the web.
This step in the process is sometimes misunderstood. You don’t need to have or set up a web server to deploy the template. You simply put the template files onto any website or web server that you have access to or that your organization maintains. For example, if you work for a small conservation organization whose website is hosted on one of the popular web hosting sites, like iPage or Bluehost, you’d log in to your account on that site and then upload the template files into a new folder in the file tree for your website. If you work in a large organization, you might work with the administrator of your organization’s website or web server to install the template files.
The location of the template’s index.html file defines the URL that will be used to access your map tour. For example, if your website is using a web server like Internet Information Services (IIS), and you create a folder in its root called C:\inetpub\wwwroot\map_tour, and your website’s domain is http://www.example.com, then the URL of your map tour will be http://www.example.com/map_tour.
Step 3—Assemble Your Images
For each point in your map tour, you will need two image files: one at full size for display to the left of the map and a small thumbnail image for display in the thumbnail strip underneath the map. Images should be in JPEG format.
For full-size images, landscape (lengthwise) orientation is recommended instead of portrait orientation. The recommended image size is 1,000 pixels wide by 750 pixels tall (a 4:3 aspect ratio). This will ensure your images look sharp on a variety of monitor sizes and fill the image area to the left of the map nicely. Images in the common 3:2 aspect ratio also work well, in which case 1,000 pixels wide by 666 pixels tall is recommended. Don’t worry if your images don’t match these recommendations exactly, because images that are larger or smaller or have a different aspect ratio still work.
The thumbnail images should be in landscape orientation and ideally 200 pixels wide by 133 pixels tall (3:2 aspect ratio).
Each point in your map tour references its full-size image and its thumbnail image on the web via a URL, so you will need to make your image files available on the web. You could put them into the same folder on your web server into which you installed the template, into a different folder or web server, or into a photo sharing service such as Flickr. (If you use a photo sharing site, make sure you can access the photo via a URL that goes directly to the actual JPEG image file and not to a web page in which the image file is embedded.)
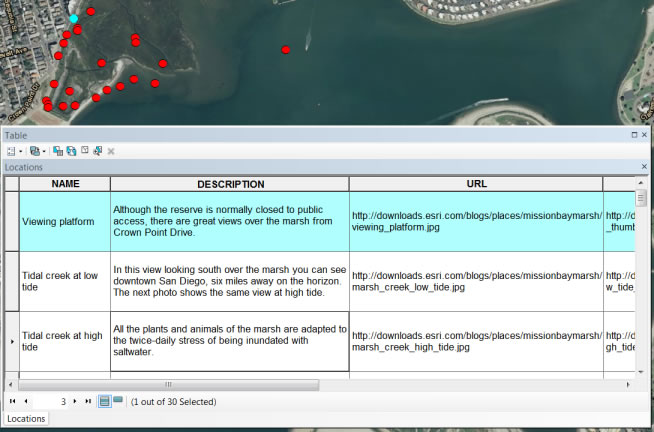
Step 4—Assemble your map tour points in a file
Assemble your map tour points in a comma-separated value (CSV) file, which is a simple text file. Each record in that file defines one point in your tour. Call your file Locations.csv. The file needs to contain name, caption, image URL, and thumbnail URL fields that are required by the template. In addition, the geographic location of each point has to be given either as latitude and longitude fields in decimal degrees or as a street address (in a single field or in separate address, city, state, and ZIP code fields).
You can create your CSV file in a text editor, like Windows Notepad, or in Microsoft Excel, which lets you export a worksheet to CSV format. The map tour template you downloaded in step 2 above includes a Samples folder that contains ready-to-use CSV and Excel files with all the required fields that you can use as the basis for your file, so you don’t have to create it from scratch. There’s also a README file in the template download that details the fields the template requires if you need more information.
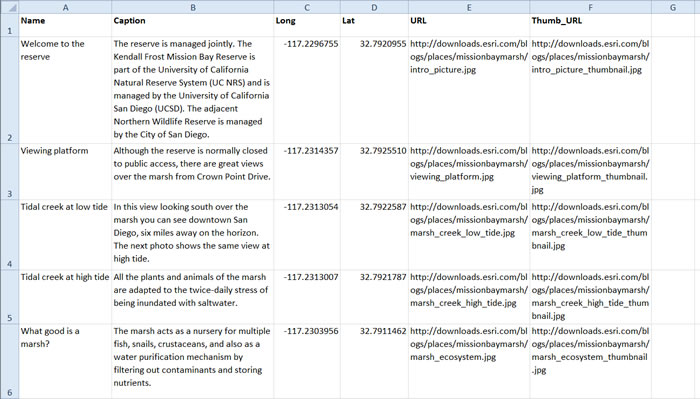
Here, the tour points file is being edited in Excel, which makes it easy to edit long strings because they wrap around in the spreadsheet cells.
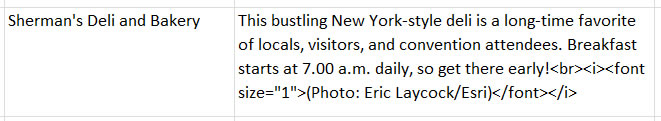
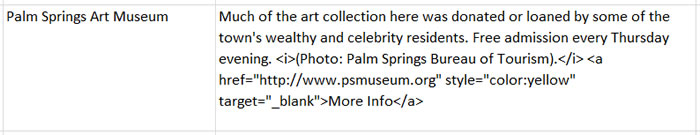
Keep the caption text short, because it will appear on top of the full-size image, and on smaller displays like the iPad, a lot of text could cover up too much of the image. Limit your captions to 350 characters or less, including spaces. The caption text can include HTML tags to define formatting and links. For example, the caption text below is formatted so that the photo credit appears on a separate line in a smaller italic font than the rest of the caption:

The caption text below contains a hyperlink. Use the target attribute to make the link open in a new browser tab so that users don’t lose their place in the tour.
The order of the records in the file determines the order in which the points will appear on the map. The first record in your map tour file is automatically treated as the introductory image by the template so that you can start the tour showing a compelling image to set the scene. The location of this record will not be shown on the map as a numbered point in your tour. You will still need to specify a location for this record in your file, but that location will not be displayed in the map tour. You can override this behavior if you don’t want your map tour to start with an introductory image. That aspect will be covered later in this tip.
Optionally, you can assemble the tour points in ArcMap as a point layer using a geodatabase feature class and then export that layer’s attribute table as a CSV file. This handy workflow saves you from having to manually assemble latitude-longitude coordinates or addresses for your points. The Samples folder contains a point feature class in a layer package with the required fields that you can use in ArcMap to edit your points. You can take advantage of ArcMap editing tools to interactively place and edit the points in your layer or use existing GIS data as the source for the points. Before you export your point layer’s attribute table from ArcMap to a CSV file, you populate the latitude-longitude fields in the feature class’s attribute table using the Calculate Geometry command in the ArcMap table window. As the order of the points in the layer determines their order in the tour, you can use the Sort geoprocessing tool if you want to reorder the records. To export the table to a CSV file, look for the Export command on the ArcMap table window’s Options menu.
Here, map tour points are being edited in ArcMap before being exported to a CSV file. You can use the Cell Height setting in the table window Appearance dialog box to make the long text strings wrap for easier reading and editing.
Step 5—Create your web map
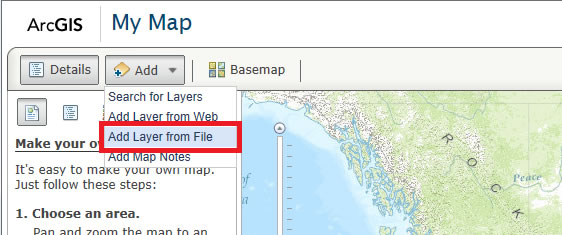
Log in to ArcGIS Online using either a free public account or ArcGIS for Organizations subscription account and create a web map for your map tour using the map viewer. Load the Locations.csv file you created in the previous step into the web map as a new layer using the Add Layer from File command on the Add menu or by simply dragging the file onto the map.
You don’t need to specify symbology or pop-up windows for the layer in the web map. The template automatically defines how the tour points layer will be displayed.
In addition to the layer containing your map tour points, you can also add supporting layers into the web map that your map tour will display. For example, if your map tour covers a particular study area, like a park or historic district, you could add a boundary into the web map showing the outline of that area. If your tour is a walking or driving tour, you could add a line to the map showing the recommended route. You can add supporting features and layers into the web map using shapefiles or any other data types supported in ArcGIS Online. Symbolize supporting layers in the web map as you want them to appear on your map tour. You don’t need to define pop-up windows for these layers because the map tour template currently doesn’t support pop-up windows for them. They are just providing context for the map reader.
Before you save your map, navigate to the default extent you want the map to display when it is used in the map tour template. The extent that your map is displaying when you save it will be the initial extent users will see when they launch your map tour. Your initial extent is therefore an important information design choice for your map tour. You may want all the tour points to be visible when the user first opens your map tour, or you may prefer that the initial extent is zoomed in to a subset of the points.
Finally, save your web map. The title and summary you use when you save the map will automatically become the title and subtitle of your map tour. Click Share and choose Everyone (public) to make the web map available to everyone.
Step 6—Configure the template
Now that you have created your web map and shared it publicly, you are ready to configure your template.
- First, configure the template to use your web map. In the template folder, open the index.html file in any text editor, such as Windows Notepad or Windows Wordpad. Look for the template configuration section of the file.
//——————————–
// Template configuration
//——————————– - In the template configuration section, update the webmap property to be the ID of your web map. This tells the application which web map to use. For example, our National Mall walking tour web map has the URL arcgis.com/home/webmap/viewer.html?webmap=a5019e8c55d547eab69c0777dcd7509a, and the ID of this map is the last part: a5019e8c55d547eab69c0777dcd7509a.
configOptions = {
// The web map id
webmap: “a5019e8c55d547eab69c0777dcd7509a”, - The FIRST_RECORD_AS_INTRO parameter listed below the web ID in the config section controls whether or not the first record in your tour points layer is to be handled as an introduction for the map tour that does not appear on the map as a tour point. By default, this is set to true. If you change this value to false, the first record in your tour point layer will be the first point shown on the map.
// Use the first data record as an introduction instead of a point
firstRecordAsIntro: true, - Close and save the index.html file. (There are some other parameters in the template configuration, but you don’t need to set them. See the README file in the download for more information about those.)
- In the App folder in the template download, open the maptour-config.js file in a text editor. These parameters at the top of the file let you change the logo graphic and links shown in the top right-hand corner of the story map. You can also change the colors used by the story map:
// Header Logo
HEADER_LOGO_URL: “resources/icons/esri-logo.png”,
HEADER_LOGO_TARGET: “http://www.esri.com”,
// Header top right link
HEADER_LINK_TEXT: “A story map”,
HEADER_LINK_URL: “http://storymaps.esri.com/home/”,
// Header, Picture Panel and Carousel colors
COLORS: [“#444”, “#797979”, “#c2c2c2”],For example, to use your own logo graphic, put the image in the resources/icons folder in the template and update the HEADER_LOGO_URL parameter with the name of your file.
- Close and save the maptour-config.js file. You can, of course, continue to edit and customize the code in any way you want! That’s why we freely provide the code for the app as part of the template.
You are done!
Your story map is now live. If you launch the URL of your map tour in a web browser (i.e., the path to the folder in which you installed the template on your web server or website), it should work.