Use ArcGIS Online and ArcGIS Living Atlas of the World to Create a Map of Flood Locations
Hurricane season, which in the United States officially starts June 1 and ends November 30, often causes devastating floods in both coastal and inland areas.
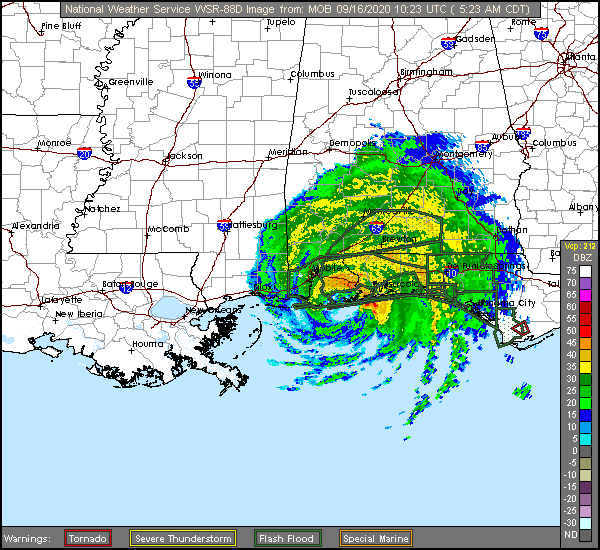
For example, coastal Alabama and the Florida Panhandle experienced massive flooding in September when Hurricane Sally made landfall in Gulf Shores, Alabama. The storm brought wind gusts up to 123 mph and torrential rains.
According to the National Oceanic and Atmospheric Administration (NOAA), flooding is the major threat for inland populations. Flash flooding can occur in the blink of an eye due to intense rainfall, often accumulating from some distance away from where the flooding occurs. Flooding along rivers and streams can last for many days after a storm has passed.
Make a Flood Map
ArcGIS Living Atlas of the World includes authoritative live feeds and other content that helps you learn more about current and predicted flood conditions. Follow these steps to make your own flood map in a minute.
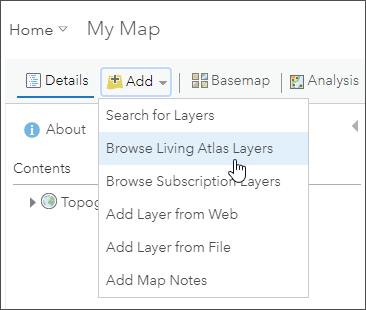
Step 1: Sign in to your account and open Map Viewer, click Add, then Browse Living Atlas Layers.
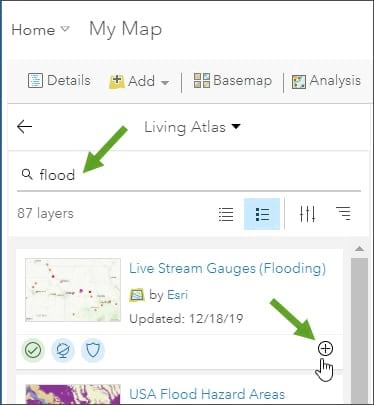
Step 2: Enter “flood” in search to locate matching layers from ArcGIS Living Atlas. Locate the Live Stream Gauges (Flooding) layer and click (+) to add it to the map.
Note: To learn more about any layer, click the layer title or card to view the item details.

Note: To learn more about any layer, click the layer title or card to view the item details.
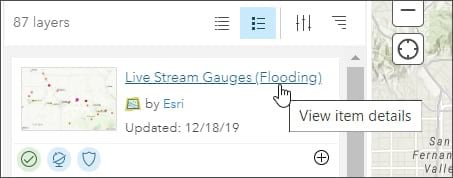
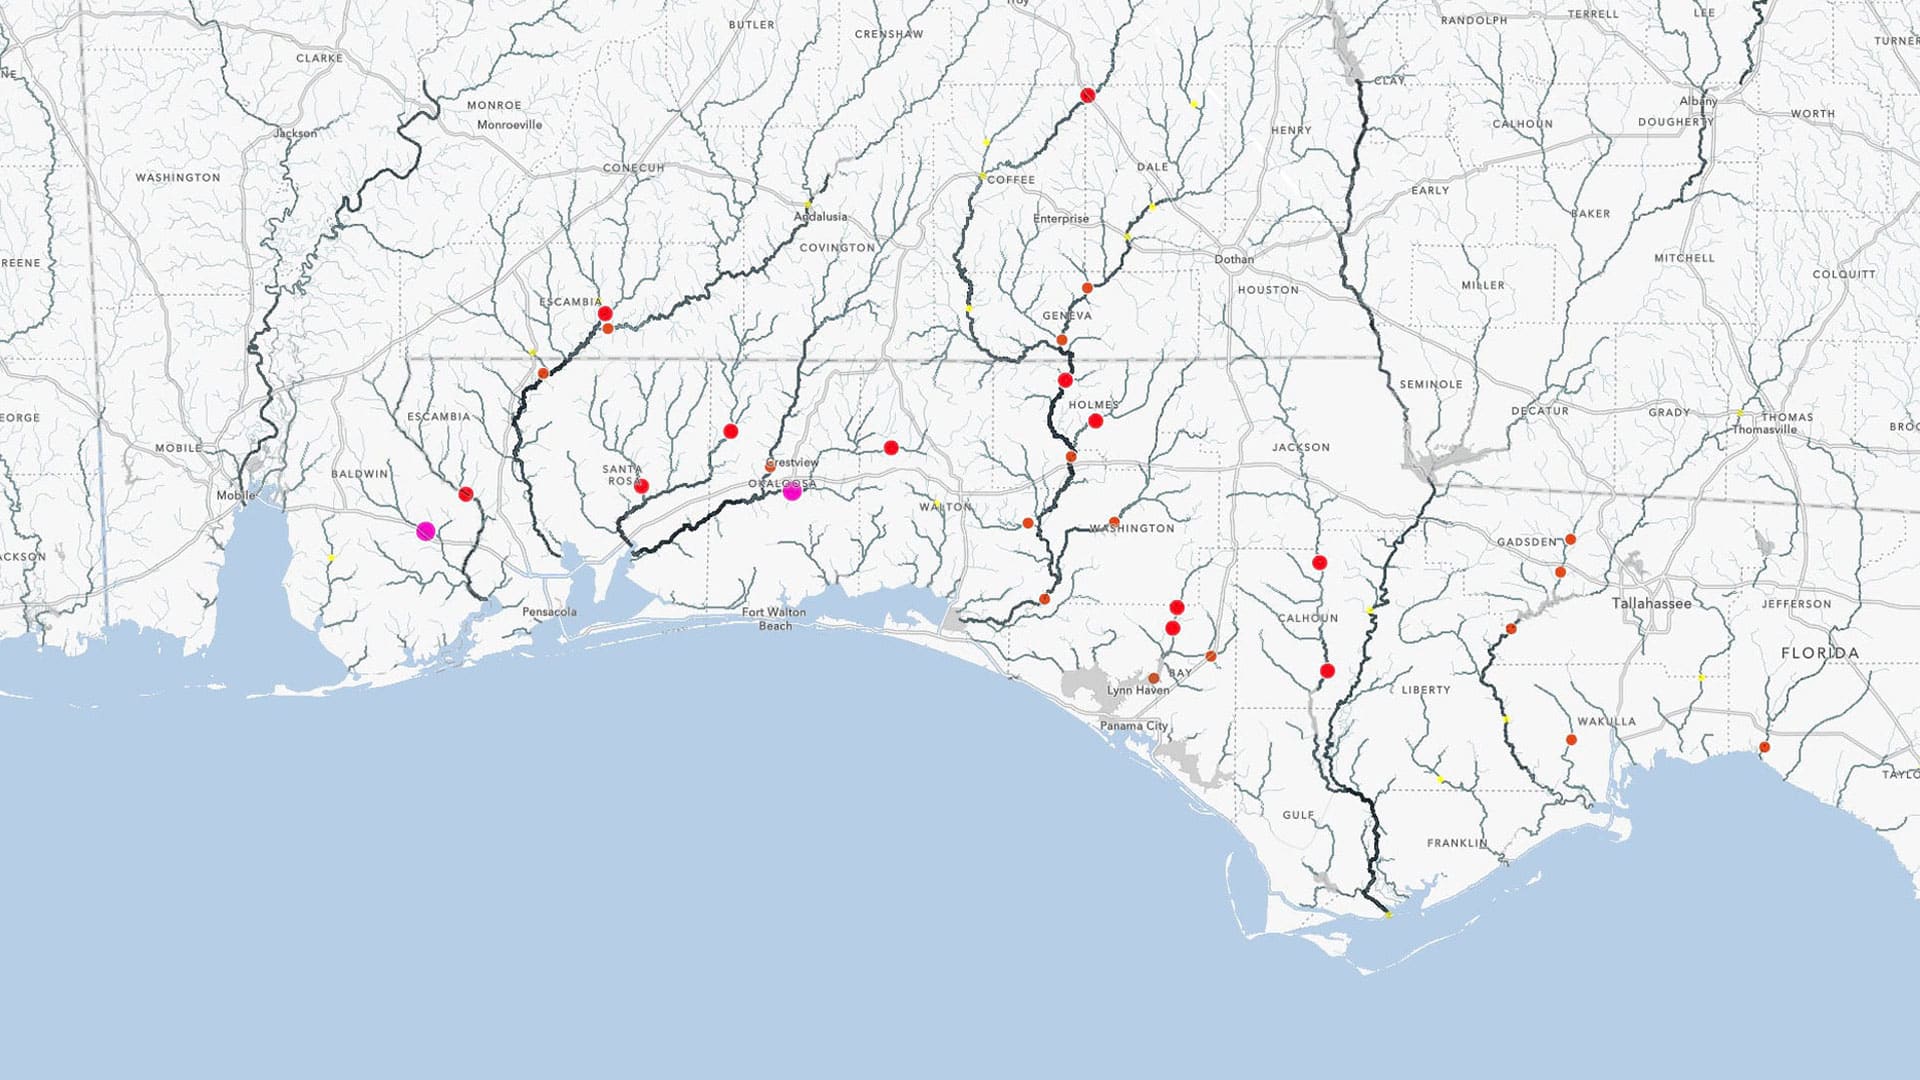
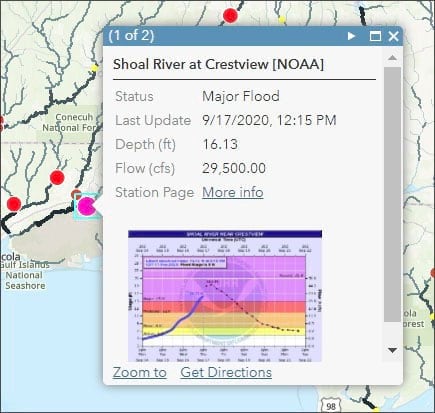
From the Live Stream Gauges (Flooding) item details, you will see that the layer shows real-time stream gauge measurements and displays the gauges currently reporting flooding. The layer also includes information about the current water flow and the flood stage. You also will see information about the source of the data in the layer.
Step 3: Return to search again using the term “flood” and scroll down to locate the National Water Model (Hourly) layer and click (+) to add it to the map.
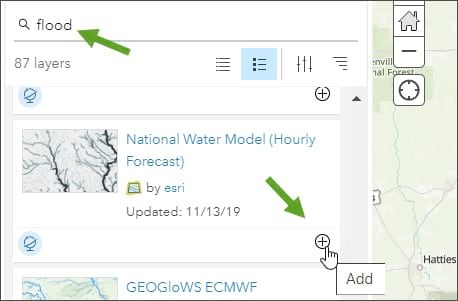
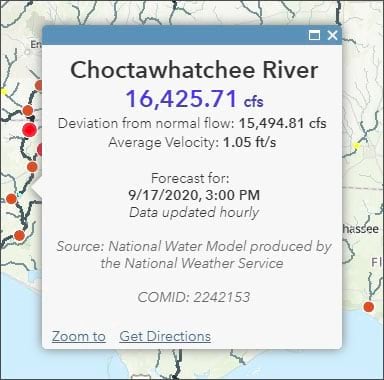
From the National Water Model (Hourly Forecast) item details, you will see that the layer presents a time-enabled model from the National Weather Service that forecasts streamflow volume and velocity for the entire United States. The model predicts the flow in every river reach of the National Hydrography Dataset.
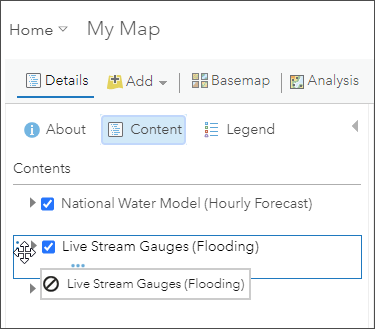
Step 4: Adjust the layer order to display the gauges on top of the streams. In Content, select the Live Stream Gauges layer and drag and drop it above the National Water Model layer.
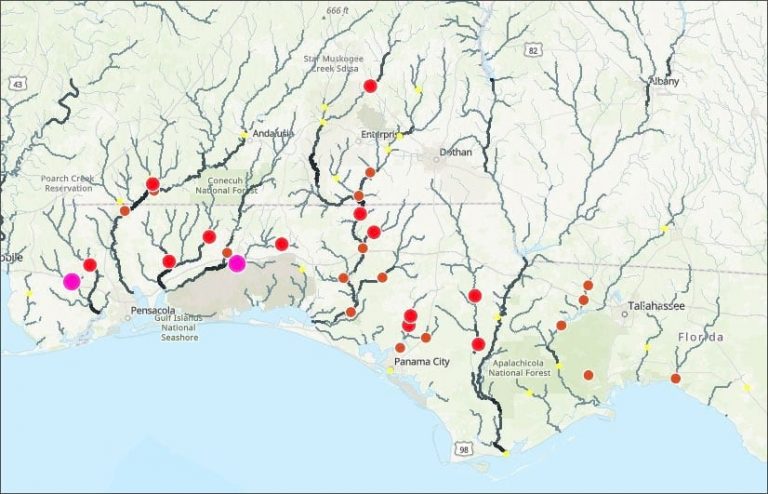
In just a few clicks, you will have created a map showing current flood conditions and hourly forecasts for streams. The map below has been zoomed to the Gulf Coast area where you can see the effects of the flooding that was caused by Hurricane Sally.
Since the National Water Model (Hourly Forecast) layer is time-enabled, a time slider appears at the bottom of the map. Using the time slider you can (a) play or pause the animation, (b) step forward or backward in time intervals, or (c) adjust time settings to set the playback speed, time span, and time display.
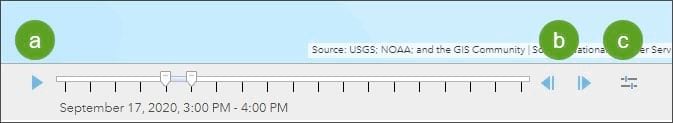
You also can click a stream to identify it and view forecast flow and deviation from normal flow for the period selected using the time slider.
To learn more about the current flow and status, click a stream gauge. Click More info in the pop-up to view details about the gauging station.
Improve Your Map
Experiment with a variety of basemaps to see which one you like best. You can alter layer transparency and symbols to emphasize the content you want. Add additional layers, such as Recent Weather Radar Imagery, USA Weather Local Storm reports, or USA Weather Watches and Warnings for additional context.
More information
For more information, see:
