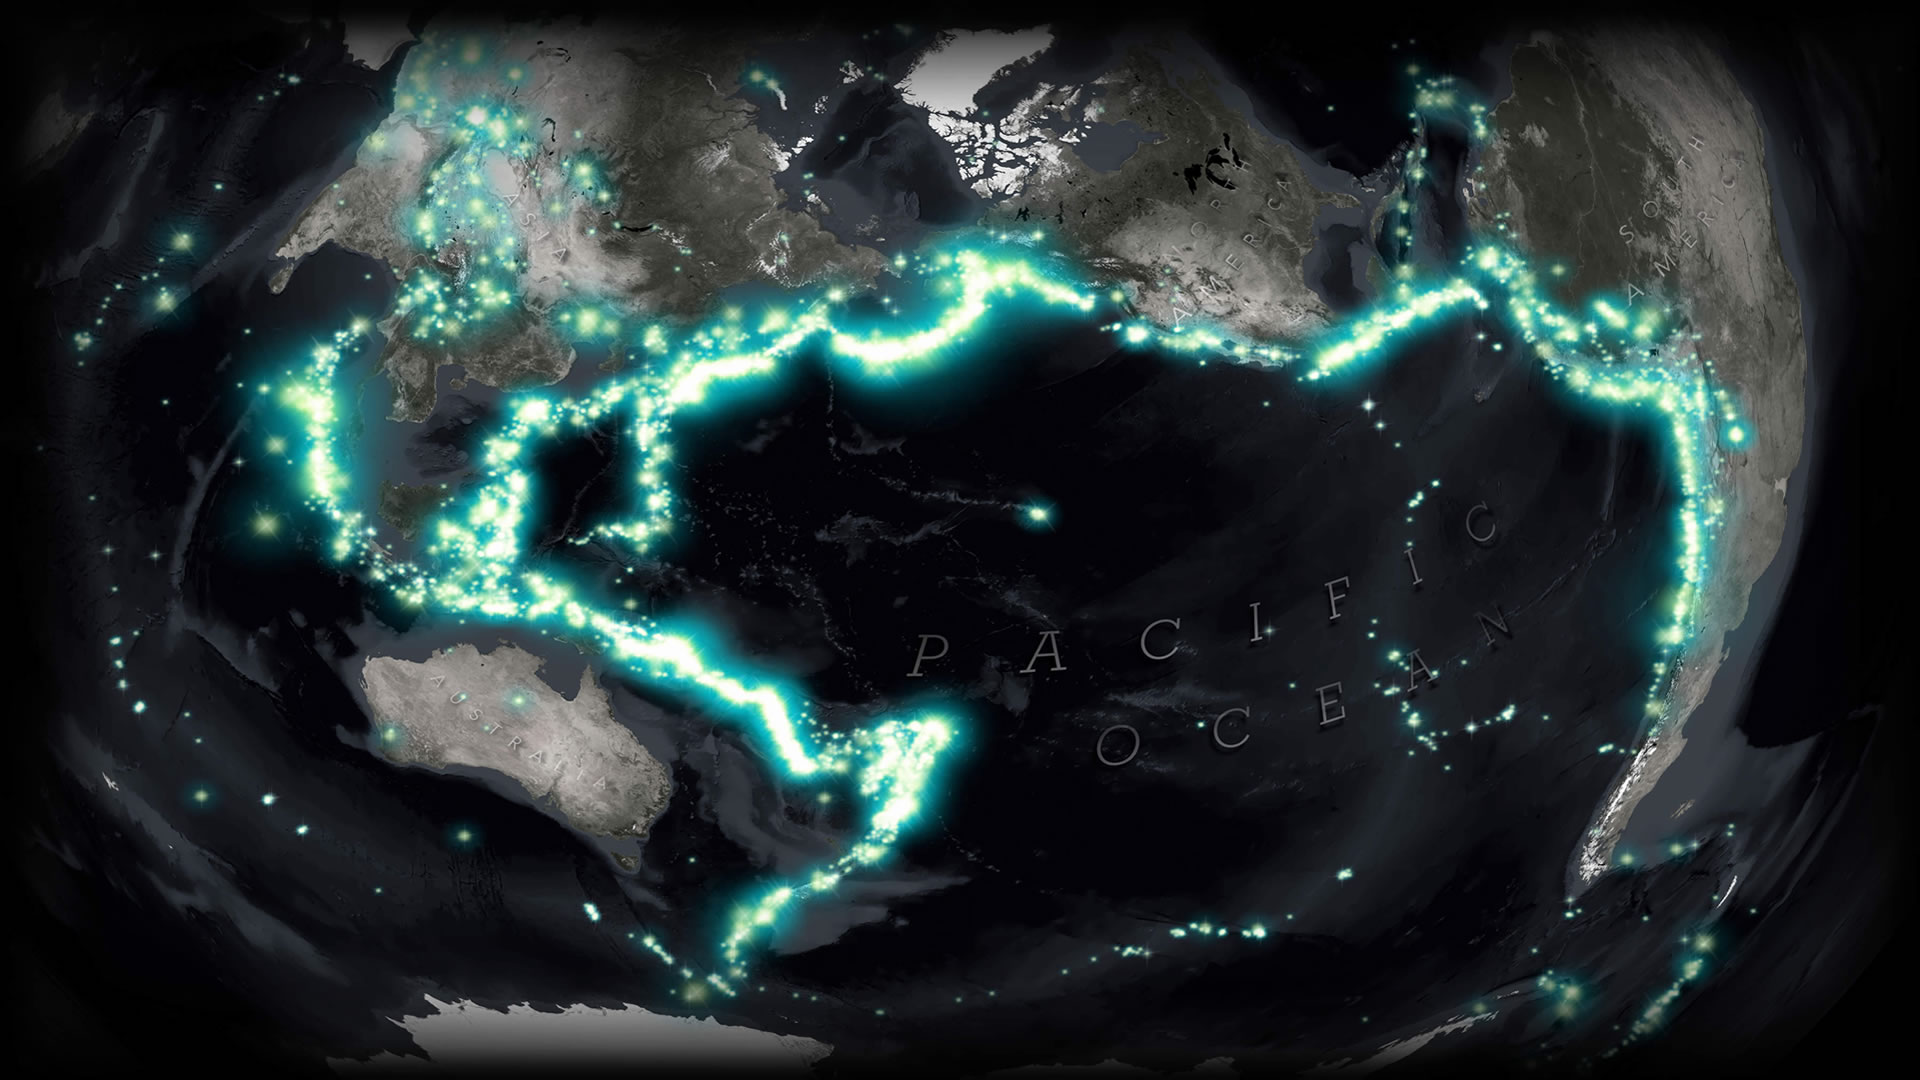
Firefly point symbols were added earlier this year to ArcGIS Online. You can use them to symbolize point data as bright, shiny bursts of color outlined by soft, glowing rings in a corresponding hue. Firefly symbols typically work best on top of darker basemaps without a lot of color or detailed features. They also can be used to give custom point symbols some extra pop on maps where you might have overlapping features at a small scale.
Customize Your Point Symbols
A great way to add unique character to your web maps is to use custom icons for your points. Your custom icons need to be hosted somewhere on the web at a publicly accessible location, and they typically look best when sized at 120 by 120 pixels. (For more information, read the ArcWatch tip “Learn to Use Images as Custom Point Symbols.”)
This article explains how firefly symbology was created for the Katy Perry: On Tour with Twitter story map at EntertainMaps.com, a web site that uses Esri Story Maps apps to tell stories about sports, music, television, and pop culture. The Katy Perry: On Tour with Twitter story map displays Tweets by singer Katy Perry in every city she visited on her latest world tour. The Twitter logo was used for each point symbol to indicate which type of media users will see when they click to open a map pop-up. The layered firefly symbols also add pizzazz by creating a halo around the symbols.
What follows are the steps that were used to create the layered symbols. You can use these steps to create your own glowing custom icons.
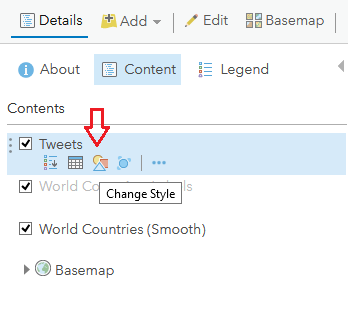
Step one—In your web map, click Content, then hover over your layer—in this case, the Tweets layer—and click Change Style.
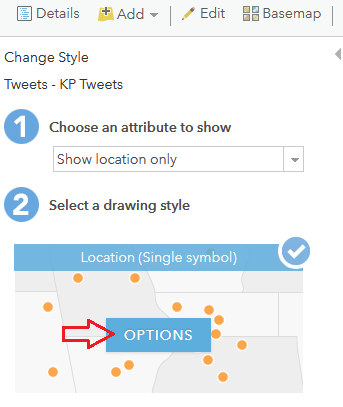
Choose Show location only, then click OPTIONS.
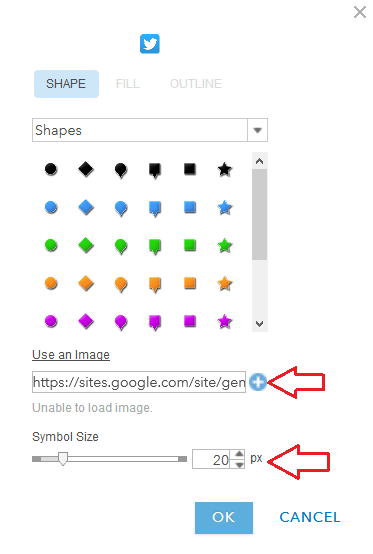
Click Symbols.
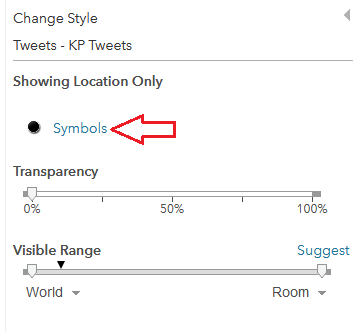
Next, click Use an Image and paste the URL of your custom symbols into the text box. Then click the plus sign (+). Adjust the symbol size as desired.
Step two—Configure the layer pop-ups as desired.
Add the Firefly Symbols
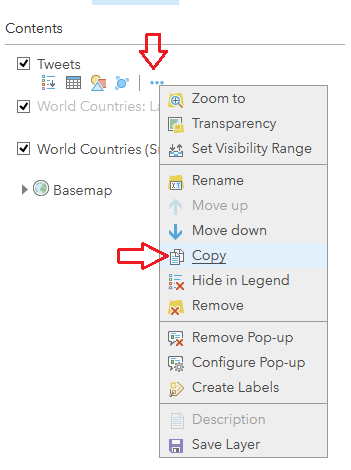
To make the symbols glow, copy the layer and use the firefly symbols and add firefly symbols underneath the original layer. Here’s how to do this:
Step one—Make a copy of the Tweets layer.
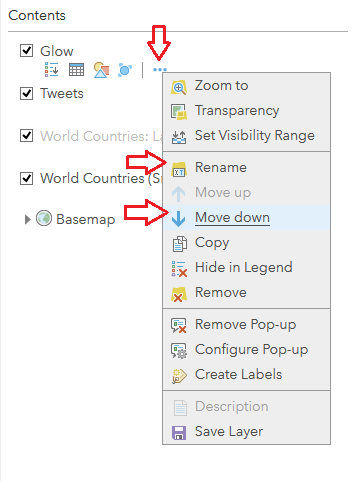
Choose Rename. Give the copy its own name and then move it one level down.
Step two—Change the symbology to Firefly. Try to pick a symbol in a color that will match or highlight the custom icon you used earlier.
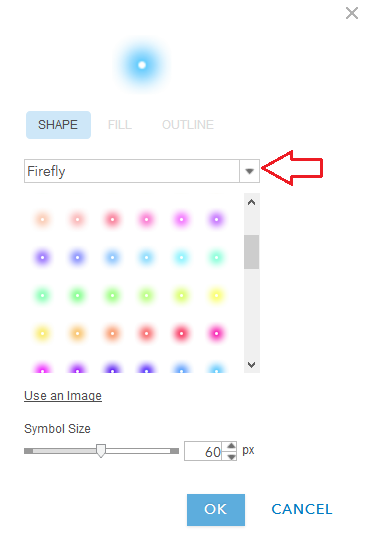
Step three—Determine the appropriate symbol size to provide a glow effect around your custom symbols.
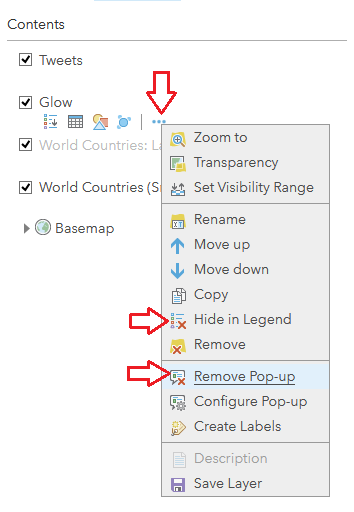
Step four—In the layer options (…), remove the layer pop-up and hide the layer in the map legend. You only want the original layer to have pop-ups and appear in the map legend.
Step five—Admire the result!
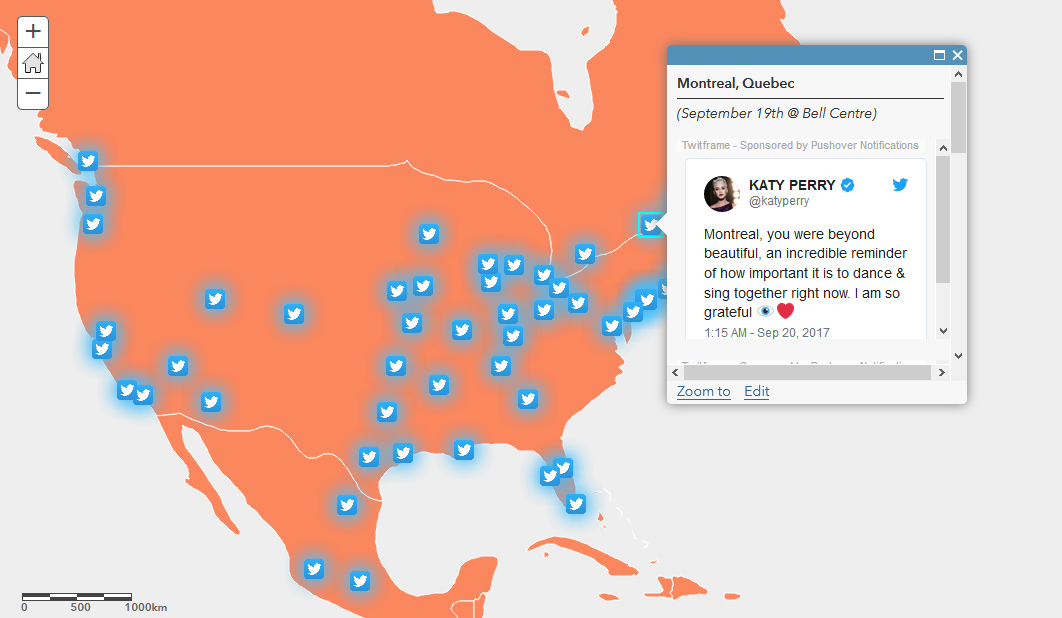
The resultant symbology has a nice glowing effect to it, making each Tweet a little easier to see and leaving the overall map looking a little more fun.
View the finished story map.
You can learn more about firefly symbology—see the story map Firefly Cartography and read Esri cartographer John Nelson’s blog post, “Steal This Firefly Style Please.”