Sea level rise driven by global climate change is a clear and present risk today and will remain so in the coming decades. Sea levels will continue to rise due to the ocean’s sustained response to warming that has already occurred—even if climate change mitigation strategies succeed in limiting surface air temperatures.
Given our propensity for coastal living, tens of millions of people in the United States already live in areas that are potentially at risk of coastal flooding, with more moving to the coasts every year. The net result of rising sea levels will be a dramatic increase in the exposure and vulnerability of this growing population, as well as the risk to critical infrastructure related to transportation, water, energy, trade, and coastal ecosystems.
ArcGIS Living Atlas of the World includes authoritative live feeds and other content that helps you visualize and understand current and predicted sea level rise.
In this tip, learn to make your own sea level rise map using ArcGIS Online and ArcGIS Living Atlas content.
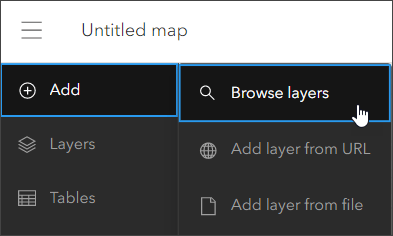
Step 1: Sign in to your ArcGIS account and open Map Viewer. There are two ways to add layers from the Content (dark) toolbar:
a. Click Add, then click Browse layers.
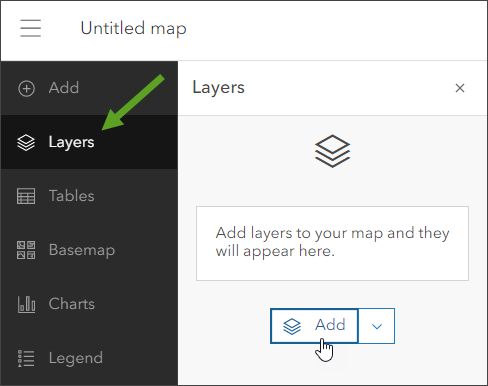
b. Click Layers, then click Add.
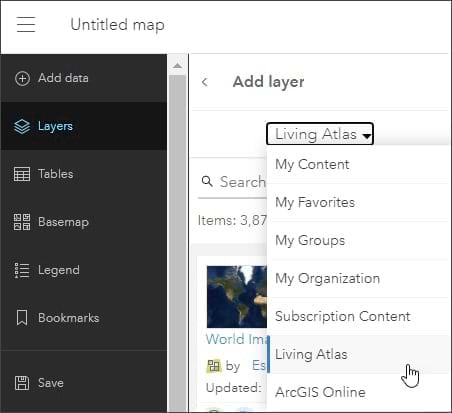
Step 2: Choose Living Atlas from the Add layer drop-down.
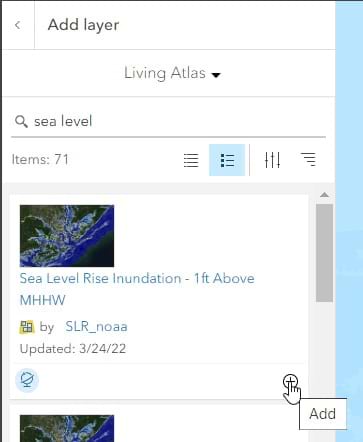
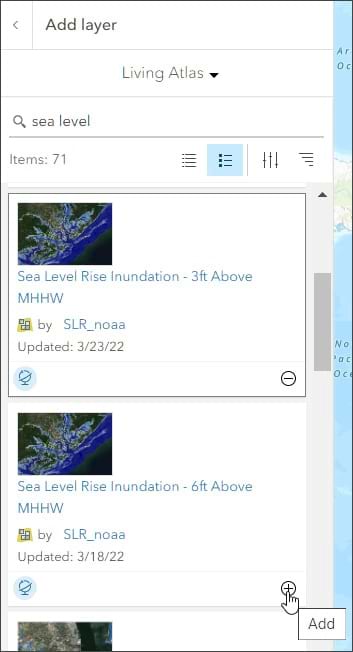
Step 3: Type “sea level” in the search box to locate matching layers from ArcGIS Living Atlas. Scroll down to locate the Sea Level Rise Inundation – 1ft Above MHHW layer, then click the Add button (+) to add it to the map.
Tip: To learn more about any layer, click the layer title to view item details.
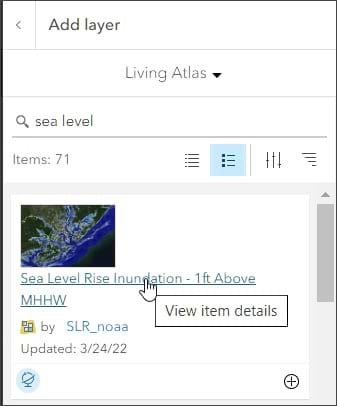
From the Sea Level Rise Inundation item overview, we learn that the layer was created as part of the National Oceanic and Atmospheric Administration (NOAA) Office for Coastal Management’s efforts to depict potential sea level rise and its associated impacts on the nation’s coastal areas. The purpose of this layer is to show potential sea level rise inundation of one foot above current Mean Higher High Water (MHHW) for the area.
Step 4: Repeat step 3 twice—once to add a three-foot layer and once to add a six-foot layer.
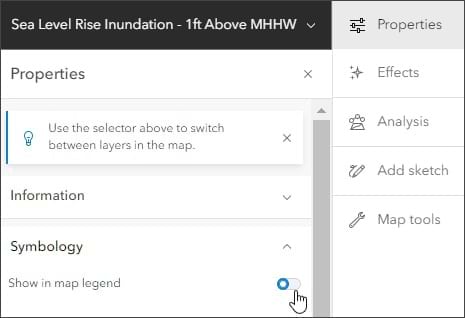
Step 5: Select one of the three layers. On the Settings (light) toolbar, click Properties, then toggle off Show in map legend. Repeat this step for each of the other two layers.
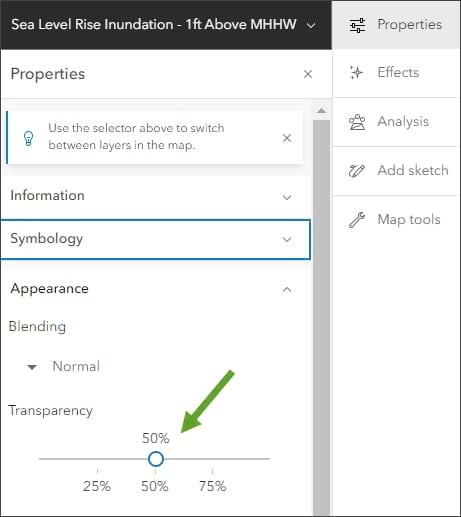
Step 6: Again, select a layer and on the Settings (light) toolbar, click Properties. Then set transparency to 50 percent. Repeat this for each of the other two layers.
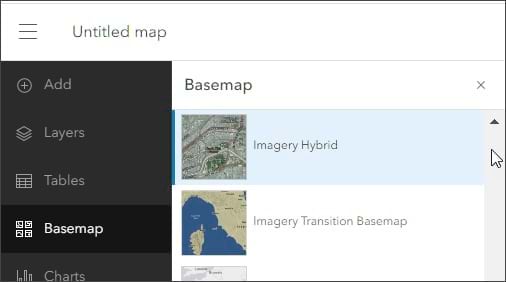
Step 7: Select an appropriate basemap. For this tip, choose the Imagery Hybrid basemap. On the Contents (dark) toolbar, click Basemap, then choose Imagery Hybrid.
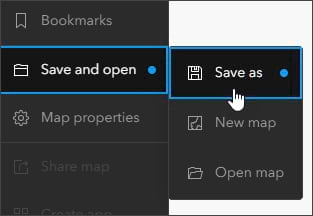
Step 8: Save the map when finished.
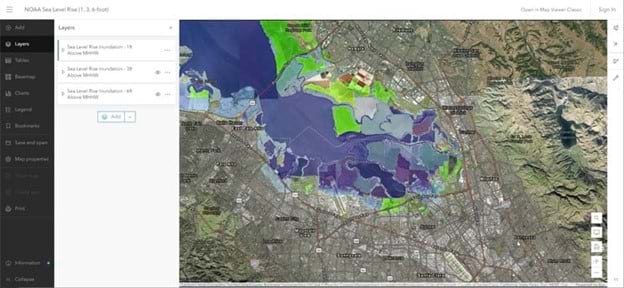
On the sea level rise sample map, the focus is on the San Francisco Bay area, near San Jose, California. You can zoom to any coastal area of interest. The sample map includes bookmarks that display areas where sea level rise may create significant impacts.
With just a few clicks, you’ve created a map showing sea level rise for one-, three-, and six-foot inundation scenarios. Toggle the layer visibility to compare and contrast the sea level inundation levels.
Make a Sea Level Rise App
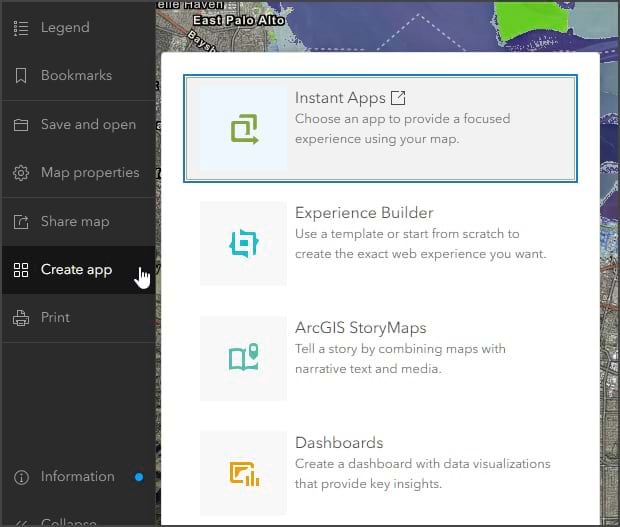
To provide an extra layer of functionality, you could also make an app enabling viewers to visualize sea level rise. From Map Viewer, click Create app and choose one of the options. ArcGIS Instant Apps provides an easy way to create a custom configured app to reach your audience.
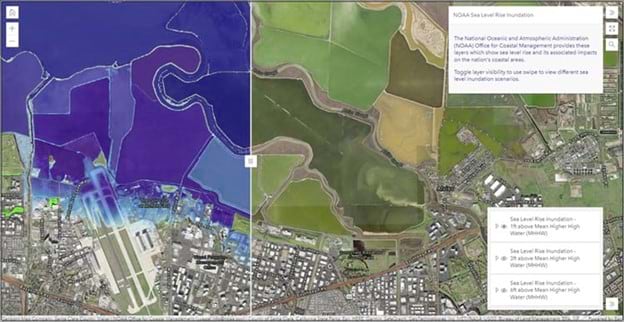
The below app created using the Media Map template in Instant Apps is configured with a swipe tool and includes the ability to toggle layer visibility across multiple layers, each showing a different sea level rise inundation area. For more information on how the app was created, see last month’s tip, Swipe Away with ArcGIS Instant Apps.
More Information
For more information, see the following: