Winter in the United States often brings freezing rain, snow, and high winds that can cause treacherous conditions for people in a storm’s path. ArcGIS Living Atlas of the World includes authoritative live feeds and other content that helps you learn about current and predicted weather conditions. You can use ArcGIS Online and the feeds and content from ArcGIS Living Atlas of the World to make a weather map in a minute or less.
Make a Weather Map
ArcGIS Living Atlas of the World includes authoritative live feeds and other content that helps you learn more about current and predicted weather conditions. Follow these steps to make your own weather map.
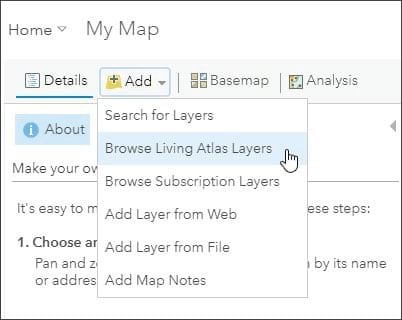
Step 1: Sign in to your ArcGIS Online account. Open Map Viewer, click Add, and then click Browse Living Atlas Layers.
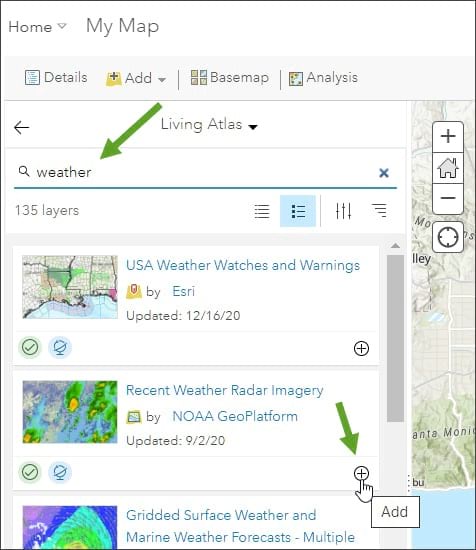
Step 2: Type “weather” in the search box to locate the Recent Weather Radar Imagery layer. Click the plus sign (+) to add the layer to your map.
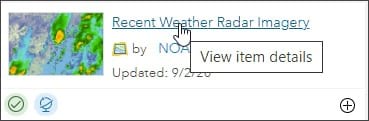
Note: To learn more about any layer, click the layer title to view item details.
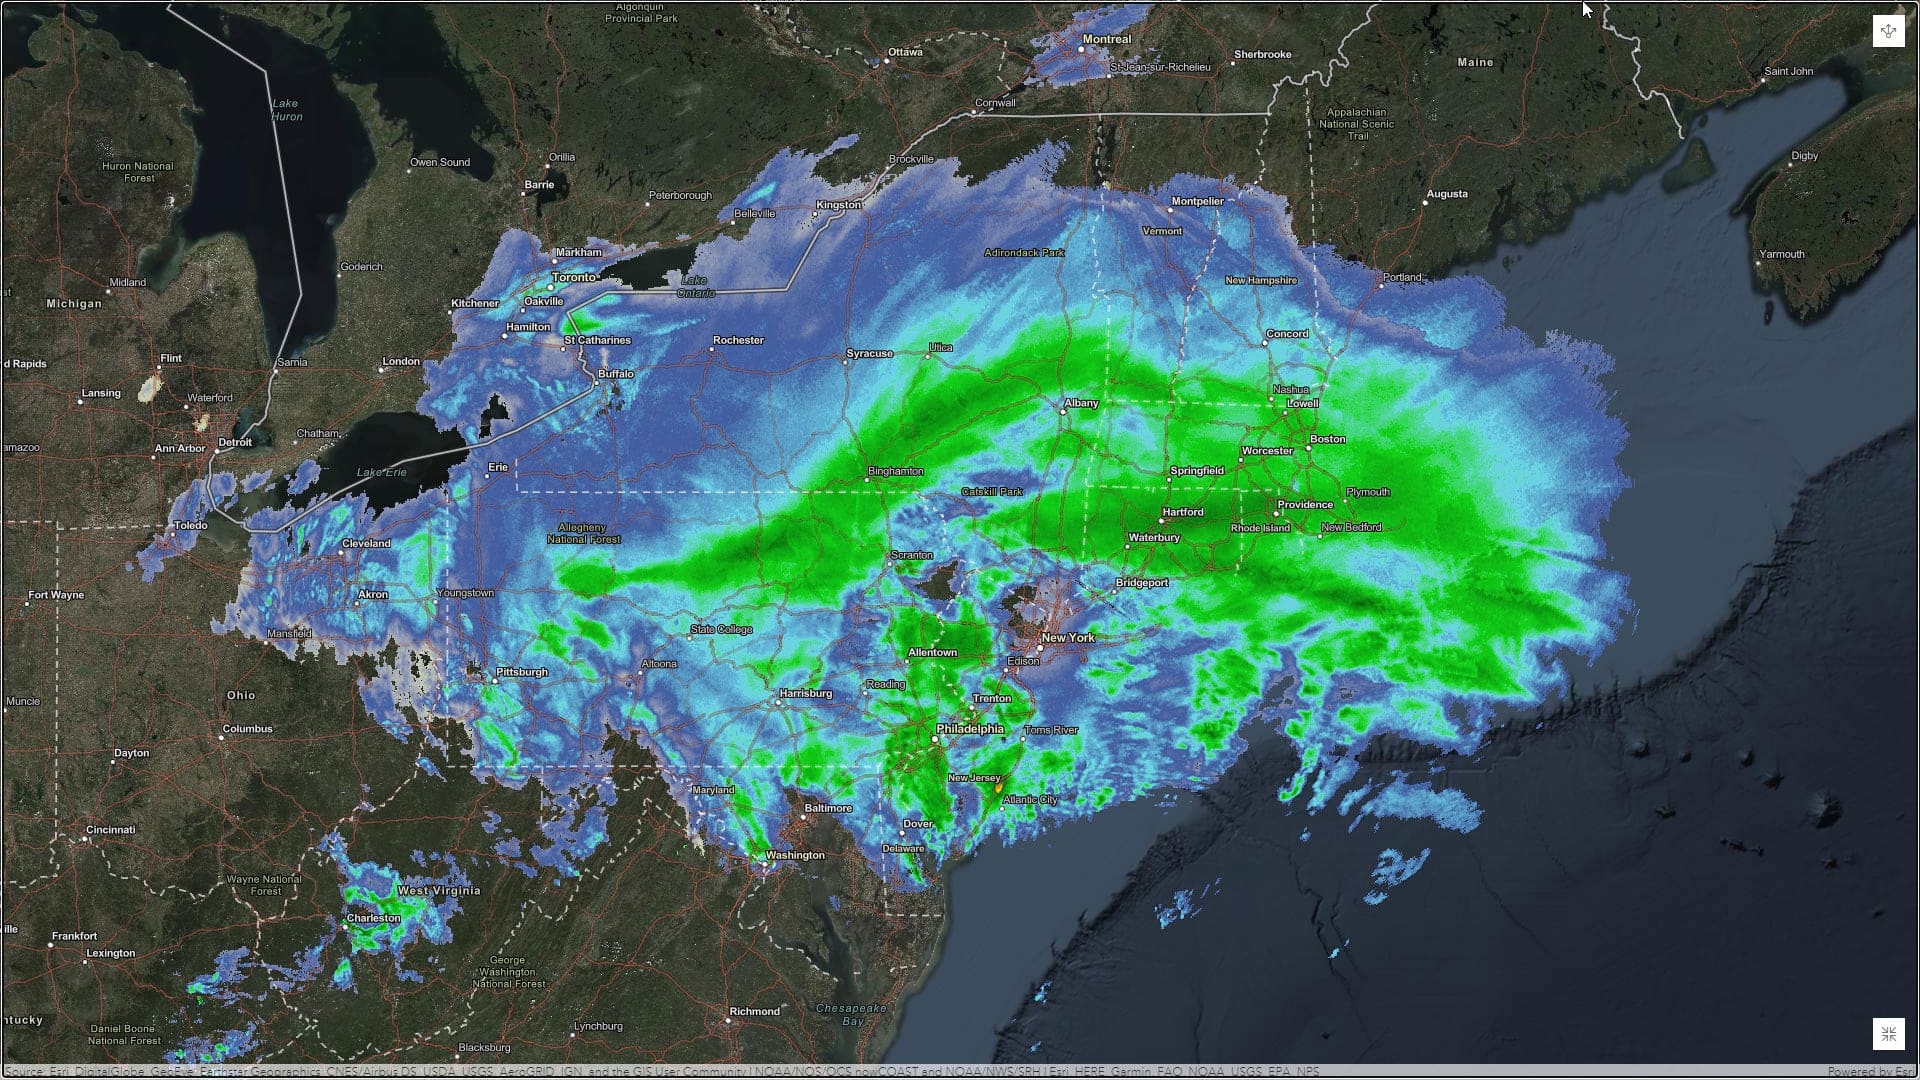
In the Recent Weather Radar Imagery item details, you will learn that the layer is managed by the National Oceanic and Atmospheric Administration (NOAA), is time enabled, and covers the last three hours. Updates occur at least every 10 minutes. The colors on the map represent the strength of the energy reflected back to the radar and correspond to the typical weather map that you often see:
- Light green: light rain, or light rain that’s not reaching ground
- Dark green: light to moderate rain
- Yellow: moderate rain
- Orange: heavy rain
- Red: very heavy rain or rain and hail
- White or blue: snow
- Pink: freezing rain or sleet or mix of winter precipitation types
At this point, you have finished making your weather map (in well under a minute). However, you can continue to explore the data by enabling time. Continue with the steps below to view weather over time.
Enable Time
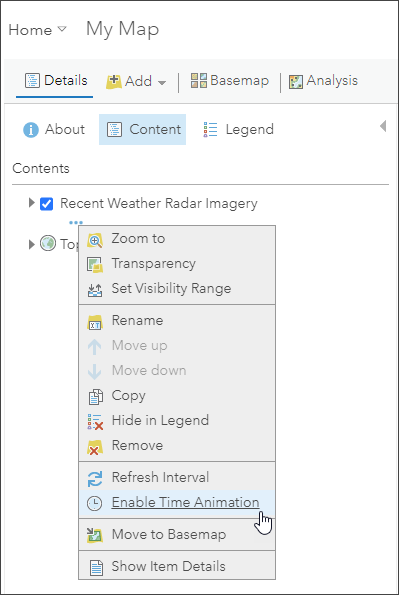
Recent Weather Radar Imagery is a time-enabled layer. By default, the time animation is disabled, but you can turn it on.
Step 3: Click the ellipses (…) for layer options, then click Enable Time Animation.
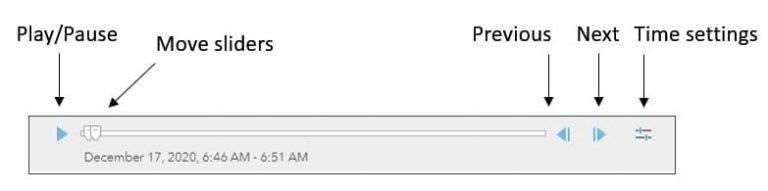
Once enabled, a time slider will appear beneath the map, with controls you can use to view and change the time animation:
- Click the Play button to begin animating the map.
- Move the sliders to manually adjust the time period that appears on the map.
- Click the Pause button to pause the animation.
- Click the Previous button to go back to the last data interval.
- Click the Next button to advance to the next data interval.
- Click the time settings to adjust the playback speed and other parameters.
Add Other Layers
There are many other ArcGIS Living Atlas of the World weather layers that you can add to your map or use in new maps. The two layers in the following steps may be of particular interest to you.
Step 4: Type “weather” in the search box and locate the USA Weather Watches and Warnings layer. Click the plus sign to add it to the map.
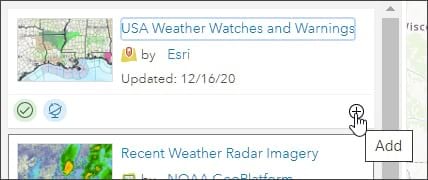
Viewing the USA Weather Watches and Warnings item details, you will see that the layer is a live data feed from the National Weather Service and contains official weather warnings, watches, and advisory statements for the United States.
Step 5: Locate the USA Weather Local Storm Reports layer. Click the plus sign to add it to the map.
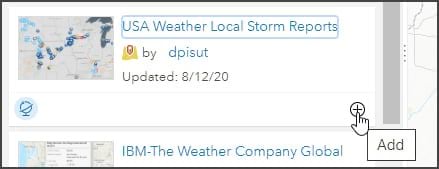
In the USA Weather Local Storm Reports item details, you will notice that the National Weather Service collects reports of severe-weather events and weather-related damage, and updates this layer at least daily.
There are other weather-related maps, apps, and layers you can explore, so browse ArcGIS Living Atlas of the World to learn more.
For more information, see the following: