The population of Seguin, Texas, has exploded in recent years, from around 29,000 in 2020 to nearly 38,000 as of 2024, according to the US Census Bureau—and this growth shows no signs of slowing. While GIS technology has long played a vital role in many of the city’s daily operations, the influx of residents has meant an additional strain on the city’s IT resources.
In December 2021, Seguin appointed its first dedicated GIS manager to transition from a file-share GIS to the ArcGIS Enterprise platform. This change aimed to enhance transparency and enable the growing Seguin population to access real-time city data that met residents’ changing needs and expectations.
The first step, according to Seguin GIS manager Travis Acklin, was using ArcGIS Hub to create a site where the city could host publicly available GIS data for residents, including a dashboard for city projects and a city zoning web app.
“The City of Seguin’s historical datasets were crucial in quickly establishing the Seguin GIS Hub, which showcases data created over the past 15 years,” said Acklin. “However, I recognized that the existing system needed to be enhanced to establish an enterprise environment.”
Acklin realized that although the GIS environment was functional, its siloed nature meant that there was no way to evaluate overall network performance.
Integrating the network with ArcGIS Enterprise has been crucial in streamlining many of the city’s functions. It freed up time for city planners and utilities employees to devote to maintaining and expanding city resources without having to worry about the functionality of the GIS environment.

Central to this integration has been ArcGIS Monitor, a software extension designed to remotely monitor ArcGIS Enterprise and IT infrastructure, providing GIS managers and teams with usage and performance information. Seguin began to use Monitor in 2021, but with the 2023 update, it has become integral to Seguin’s GIS framework.
Put the Pieces Together
“Historically what we’ve had outside of ArcGIS Monitor was just normal IT server logs,” said Acklin. “System administrators would look at the memory that was being utilized, the CPU, and storage. It was just the traditional PDQ [Inventory] reports that would show up monthly saying, ‘Here’s how your GIS servers are performing.’”
However, these server logs did not display information about specific GIS services. This became a missing link as those services began to expand across the city.
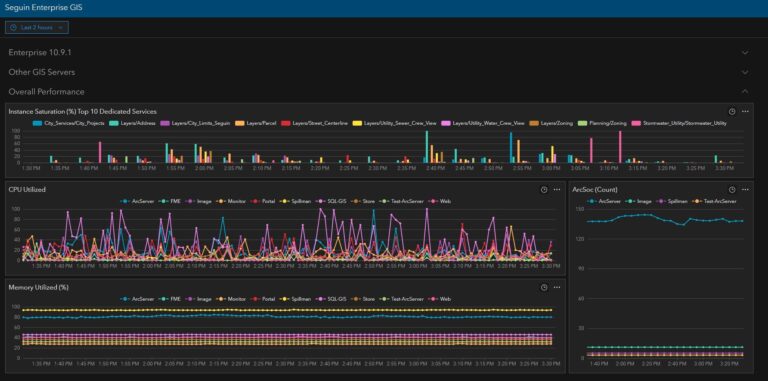
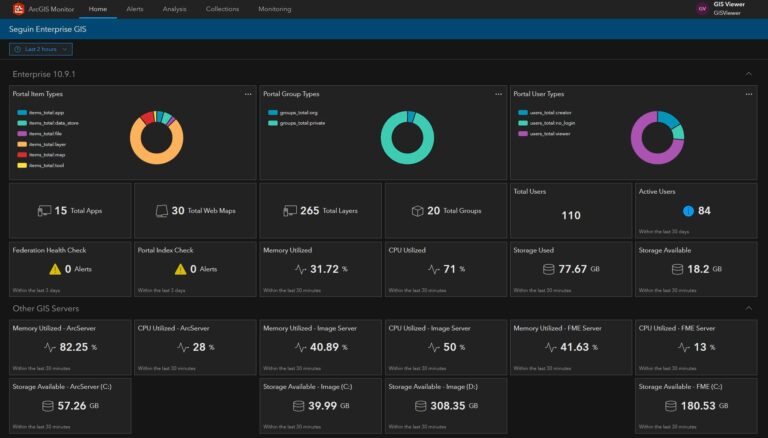
With ArcGIS Monitor, IT staff can view the performance of each individual service, and also increase or decrease their instances depending on how and when they are being used. When a server is being taxed, IT staff can see immediately with the ArcGIS Monitor interface what might be causing performance issues and take action to correct issues based on those metrics.
“We have a proposed housing dashboard that gets pinged on a regular basis,” said Acklin. “Monitor will allow me to watch the performance of the services and if we are taxing the overall server or services. It then allows me to analyze the performance and make sound improvements that will allow for better performance.”

The sooner Acklin knows about a service’s performance issues, the sooner he can correct the application’s performance. The successful utilization of ArcGIS Monitor is invisible to the end user but is a key component of overall analysis and performance of the enterprise GIS environment.
“Ingratiating enterprise GIS into the fabric of the City of Seguin to build a robust GIS platform has proven to be invaluable to our rapidly growing community,” said Seguin chief information officer Shane McDaniel. “ArcGIS Monitor was the bridge that fused IT and GIS.”
Update the Framework
In addition to being able to resolve issues when they arise, GIS staff can monitor system usage to determine which GIS services are being used daily. Staff can also see which services can be converted from a dedicated instance to a shared instance within the ArcGIS Server Manager application to help the overall server performance within the ArcGIS Enterprise framework.
“It’s just using our resources to get the most out of the servers and the taxpayers’ money, because that’s the infrastructure that we have in place in the city,” said Acklin.
The 2023 ArcGIS Monitor update has been a boon for Seguin’s GIS operations. The update introduced improvements such as a streamlined interface that made it more user-friendly and efficient, particularly for those without a deep technical background.
“It makes it easier for nontechnical individuals and [is] more focused on drag-and-drop-type setups and simple codes that non-programmers can set up,” Acklin said.
Since that update, Seguin has worked to get the most out of its revamped interface. The simplicity of evaluating data metrics has curtailed the amount of time spent finding and troubleshooting performance issues. The update has also made it much easier to communicate performance data to city staff.
The new interface gives city employees and officials who aren’t familiar with ArcGIS Monitor a better understanding of overall system health and performance issues that may need to be addressed. The interface also empowers staff to make decisions based on clear visuals and easy-to-interpret charts.
“We’re a small shop,” said Acklin. “But we’re growing, so we must utilize our time efficiently. [ArcGIS Monitor] has allowed us to focus on what’s needed—to see issues in real time and be able to fix them in a quick fashion.”

