It’s no secret that animal and plant life all over the world depends on the stability of its habitat for survival and that humans change the surface of the planet every day, directly and indirectly, in more ways than we can count. Faced with these threats to habitat sustainability and biodiversity, understanding and analyzing the health of ecosystems have never been more important.
Fortunately, this type of risk assessment is exactly what the International Union for Conservation of Nature (IUCN), the world’s largest network of environmental organizations, set out to achieve with its Red List of Ecosystems (RLE). The RLE documents the conservation status of ecosystems throughout the world and highlights those that are at risk of collapse.
“We first helped develop the RLE standard, starting around 2010, to complement the long-established IUCN Red List of Threatened Species,” said Patrick Comer, chief ecologist for NatureServe.
NatureServe, a member of the IUCN since 2005, is an umbrella institution for the network of Natural Heritage Programs and Conservation Data Centers located in each state and province across the United States and Canada. The organization provided advice on RLE criteria and has now implemented it as part of its evaluation of North American ecosystems.
RLE criteria and indicators include assessments of ecosystem type distribution and its key ecological processes. The analysis involves mapping or modeling each ecosystem type distribution, then documenting trends in its extent and ecological condition over time, from the pre-industrial era to 50 years in the future.
A Higher Standard of Ecosystem Assessment
NatureServe used ArcGIS Pro, in combination with other GIS software, to implement the RLE standard, modeling both declining and restricted ecosystem distributions in temperate and tropical North America. Once assessed, the ecosystem types were categorized as Vulnerable, Endangered, Critically Endangered, Near Threatened, Least Concern, Data Deficient, and Not Evaluated.
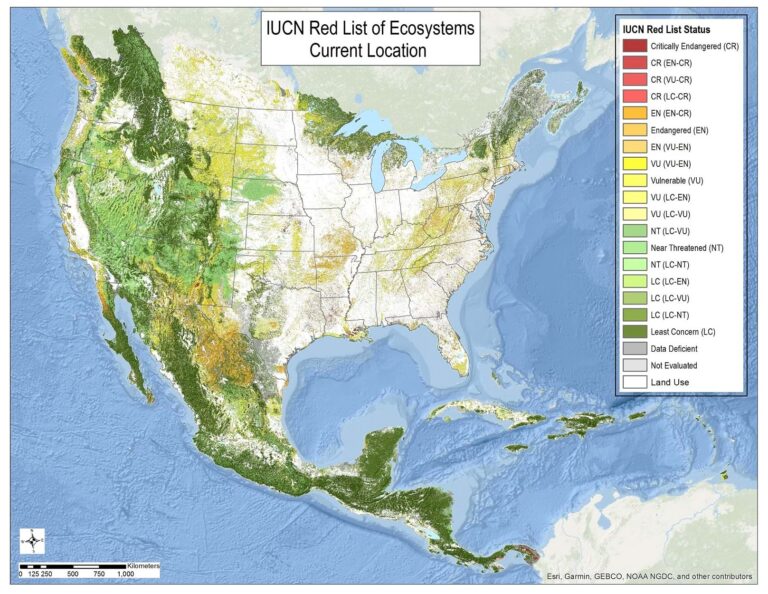
To determine long-term ecosystem loss, NatureServe compared the mapped extent of pre-industrial distributions with those of today, analyzing an area from southern Canada through Central America and the Caribbean that makes up 8.5 percent of the global land surface.
To complete this analysis, the NatureServe team combined georeferenced observations with satellite imagery, as well as elevation, landform, and soil data.
“The spatial models we create from this data often use tools like random forest to identify the explanatory relationships between mapped areas and their related georeferenced observations,” said Comer. Random forest is a machine learning method found in ArcGIS Pro that can be used to classify various kinds of data.
“Methods for land-cover and ecosystem mapping have advanced considerably over the past 20 years,” Comer added. “While the original methods and information systems at NatureServe were built around nonspatial relational databases, [ArcGIS] technology became foundational to how we develop, analyze, and visualize spatial data for biodiversity conservation.”
Factors used to gauge the probability of ecosystem collapse include trends in ecosystem extent (the physical area that the ecological system covers), the restricted nature of its distribution (the pattern or arrangement of the system), and the relative severity of environmental degradation.
“We identified 34 percent of the North American terrestrial ecosystem types as threatened,” said Comer. That is, they score as either Vulnerable, Endangered, or Critically Endangered under the RLE standard.
“Historically, [threatened] ecosystems occurred across about 45 percent of the continental study area,” Comer added. “Today, they account for about 30 percent.”
That means that nearly one-third of today’s landscape supports ecosystem types that are in urgent need of conservation attention.
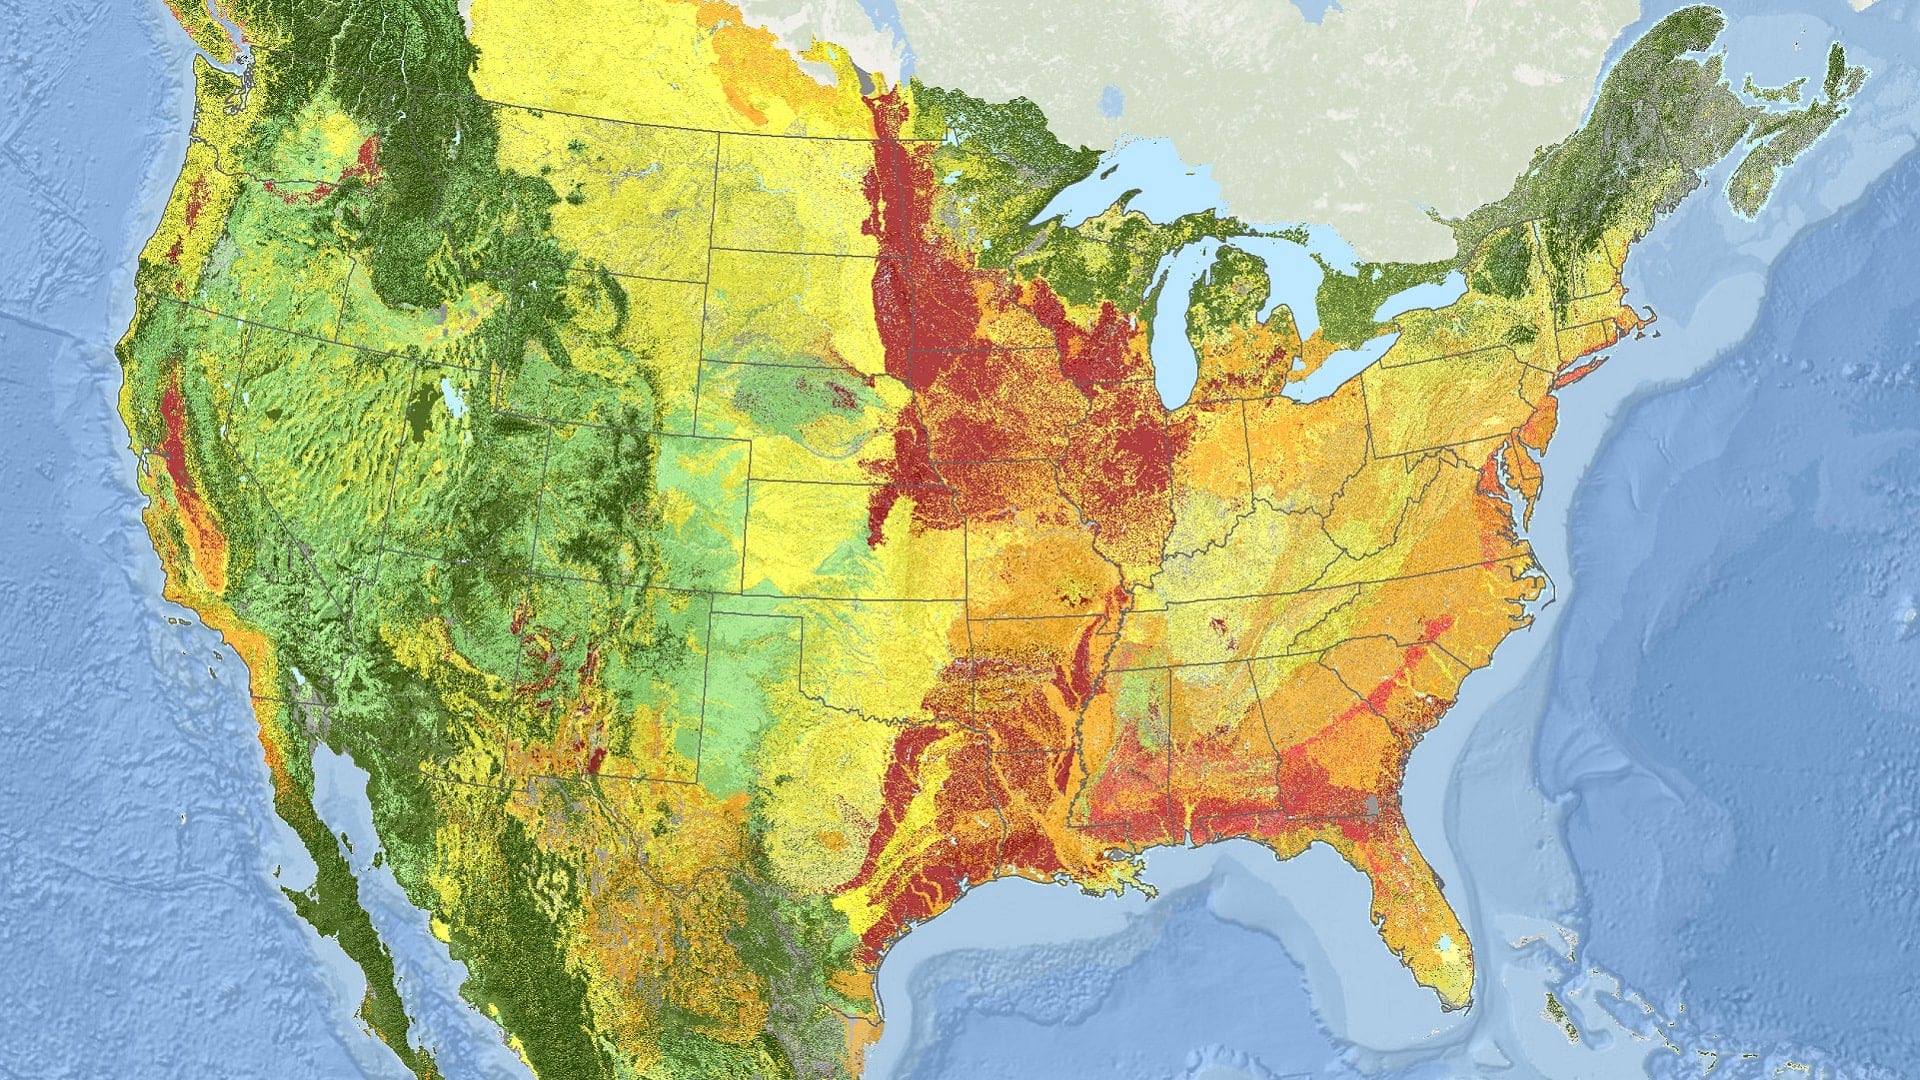
The most critically endangered ecosystems in the US are concentrated in the Midwest, Lower Mississippi Valley, Gulf Coastal Plain, and California’s Central Valley, where large proportions of forests were cleared, grasslands were plowed, or large wetlands were drained for intensive land uses like agriculture and rangeland for livestock.
A Habitat for More Than Humanity
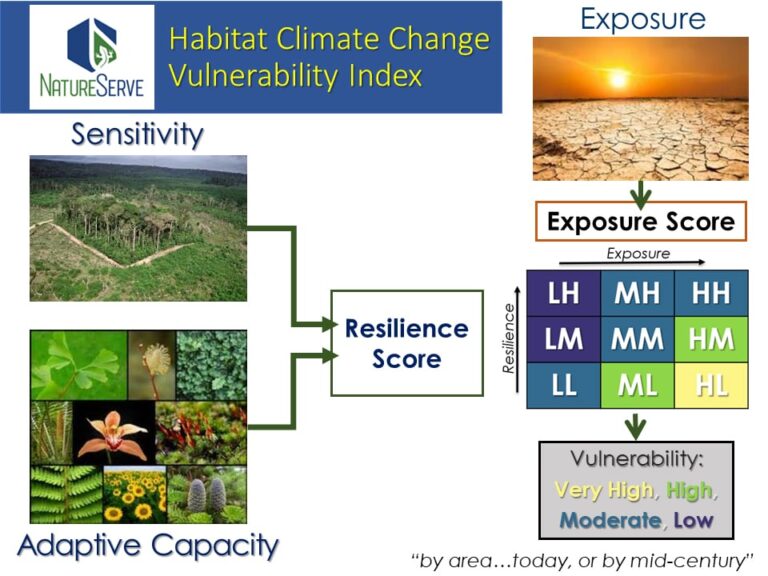
To complement the RLE and other climate change tools used in its analyses, NatureServe has also developed the Habitat Climate Change Vulnerability Index (HCCVI) assessment framework. The HCCVI framework uses available data to determine the vulnerability of habitat types to the effects of climate change, measuring climate exposure and ecosystem resilience.
“We need to apply as many criteria and indicators as feasible to fully establish red list status under the RLE,” said Comer. “The HCCVI provides a pathway for factoring climate change into RLE assessments.”
With the HCCVI, NatureServe comes away with a more complete view of the status of a given ecosystem. After compiling the results of RLE and HCCVI analyses, NatureServe can pinpoint the source of ecosystem stress and develop targeted strategies for conservation.
“Our assessment approaches, including the RLE and HCCVI, illustrate the power of linking remotely sensed data to spatial modeling to document trends and inform conservation responses from continental to local scales,” said Comer. “It provides a method for governments to prioritize conservation efforts and researchers to advance knowledge critical to natural resource conservation assessment, planning, management, and monitoring.”
Partly because of what he and the NatureServe team have achieved in implementing the RLE standard, Comer is optimistic about the future of technology’s role in conservation efforts.
“I feel so fortunate to have spent my career in this time of rapidly developing technology and ever-expanding big data, which helps us address challenges to our environment,” he added. “And I am thrilled to think about what we’ll be able to accomplish over the next decade.”
