
Located in the central stretch of Florida’s popular east coast, Brevard County is home to over 600,000 residents, many of whom are recent transplants to the area. On top of this, beaches and other attractions render the county a year-round tourist destination. While beneficial for the local economy, high levels of traffic can put a lot of added strain on streets and highways, making roadway management and maintenance a top priority for the county’s public works department.
“The size of the county can make field visits by staff for inspection and repairs very time-consuming,” said Chris Ireland, special projects coordinator for the road and bridge maintenance division of the Brevard County Public Works Department, referring to the county’s nearly 1,200 miles of paved roadway.
To help maintain this extensive system of roads and bridges, the county employed a consultant to conduct a pavement condition assessment. Ireland provided the consultant with an existing roadway database developed with old ArcGIS desktop software. It contained Brevard County’s paved and unpaved roadway inventory and associated data, which the consultant then augmented with data collected from the field, including pavement stress indicator values.
Crucially, these additions to the database included an index tracking the condition of structures and pavement, plus mileage counts and a massive image library—a whopping 7.4 terabytes.
“We explored the data using ArcGIS Pro and noticed that the image folders were structured in a systematic way,” said Lixin Huang, IT engineer for Brevard County. With the right code, staff would be able to automate the process of extracting each image along with its related shapefile.
That gave Ireland and Huang an idea—if they could use this imagery to develop a street viewer with a detailed view of the county’s roadway system, they could more accurately assess and address maintenance requirements, construction projects, and resident concerns.
Millions of Images at the Street Level
The central problem Ireland and Huang faced was that the project would be a massive undertaking—both in terms of the time it would take and the scale of information the team would be handling.
“Because of the amount of data involved, we purchased additional servers to manage the imagery and avoid burdening our existing GIS infrastructure,” said Ireland.

Due to the scope of the project, ArcGIS Enterprise was selected as the platform to develop the street viewer web application.
The first step was to review and process the roadway imagery collected during the course of the pavement condition assessment. The imagery had been collected with several vehicles driven throughout the county. Each vehicle was outfitted with four mounted cameras, including a high-resolution camera positioned at the bottom of the vehicle to collect pavement imagery.
“We developed a stand-alone Python code to extract various data from the individual camera folders,” said Huang. “The folders were structured by date, location, and the camera used.”
Additionally, Huang noted, each folder contained shapefiles of the data points where the photos were taken.
Because of the folder structure and file naming convention used, Ireland and Huang were able to use the Python code to store all the shapefiles in one folder location. All in all, this yielded 1,104,468 data points corresponding to right-of-way images collected by the mounted cameras.
ModelBuilder—visual programming software for geoprocessing in ArcGIS Pro—was used to automate the process of loading the shapefiles into a file geodatabase as separate feature classes, as well as adding attributes such as Image Path and Image ID. A separate model was used to merge all the individual feature classes for each data point into one final feature class.
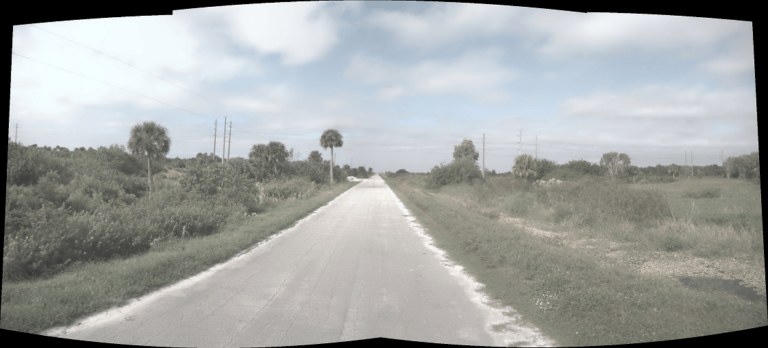
“We researched some code snippets from the Python reference library and found some code that could stitch several photos together to form a panoramic image,” said Ireland.
From there, Ireland and Huang were able to customize the code to better suit their purpose. The final code created a panoramic view using images from three of the car-mounted cameras.
“The stitching process was divided into small batches and run individually,” added Huang. “If any of the batch runs failed, only that batch needed to be rerun, [which] reduced the amount of rerun processing time. The code for stitching the images together has the capability to run at any point of a batch.”
Additionally, the stand-alone Python code is designed to generate log files that can assist with troubleshooting code issues and getting statistics from the results.
Ireland and Huang then used ArcGIS Web AppBuilder in ArcGIS Enterprise to develop the final street viewer app.
A Lasting Impact
The app quickly proved to have an outsize effect on the county’s public works efforts. For one thing, being able to remotely assess assets can save crews a huge amount of time when responding to residents’ inquiries and service requests. It also provides the staff working on the pavement management plan with a clear view of roads that may need repair. The images, along with the pavement indexes, greatly assist with planning the repaving schedule, which has accelerated over the last five years due to increased traffic in the county.
“When we run the pavement condition assessment again, it will be interesting to compare the two sets of imagery,” said Ireland. “This will give us additional insight into managing and maintaining our roadways in the county.”
The applications for the street viewer tool don’t end there—it has also proved helpful in the inspection of stormwater structures, maintenance holes, curbs and gutters, and management of road striping, signage, and traffic signals. Ireland noted that the street viewer could also be used in the event of legal disputes involving any of these assets, or when claiming reimbursement from the Federal Emergency Management Agency (FEMA) if the county suffers damages from major storms and hurricanes.
“The street viewer can be employed in ways that we hadn’t imagined when we first developed it,” he said, hammering home the idea that when it comes to ensuring that a county’s infrastructure is at its best, few things are better than having a clear, comprehensive picture of it.
