
The Ogden City Police Department Uses Esri Technology to Plan and Manage Security for a Train Celebration
Technologies old and new came together in downtown Ogden, Utah, one day last spring, culminating in a spectacular and safe Spike 150, the sesquicentennial celebration of the completion of the first transcontinental railroad.
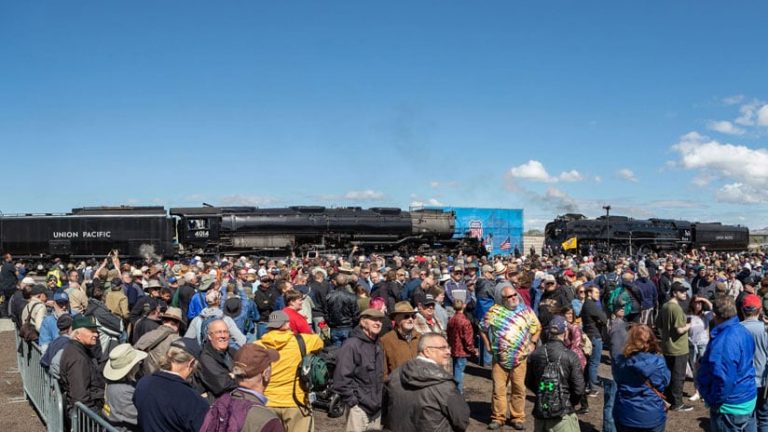
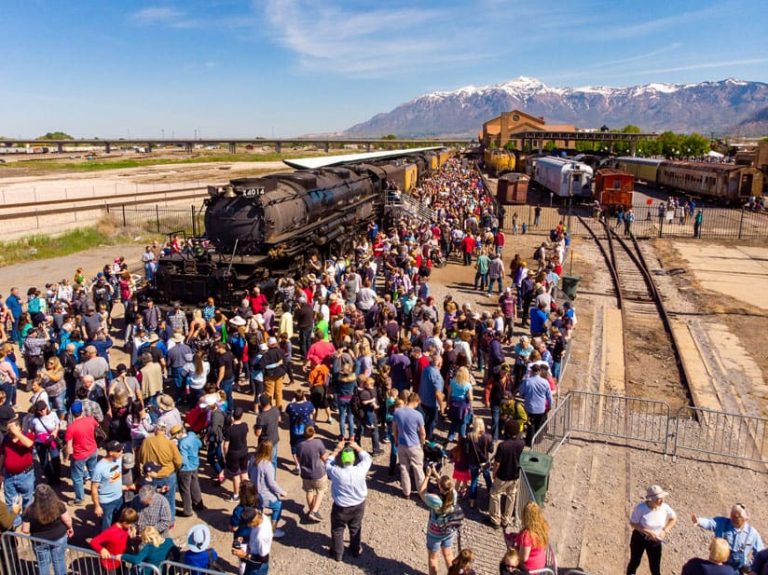
Wowing the crowd of 5,000 people who gathered near Ogden Union Station on May 9, 2019, were Union Pacific Railroad’s mighty steam locomotives Big Boy No. 4014 and Living Legend No. 844. These iconic engines brought train enthusiasts to Ogden from across the country, and even the world. Many people followed them from stop to stop on their route to the city.
The two 1940s-era locomotives were ceremoniously joined on the railroad tracks to mark the moment 150 years ago—May 10, 1869—when the Central Pacific and Union Pacific Railroads were coupled at Promontory Summit in the Utah territory. That so-called “wedding of the rails,” during which a 17.6-karat-gold spike was driven into the railroad, opened the West to waves of settlers shortly after the Civil War.
“Thanks to the leadership of Abraham Lincoln and others, we have this transcontinental railroad to help us come together as a nation,” Utah governor Gary Herbert said at the reenactment ceremony at a site just south of Union Station.
Behind the scenes, however, technology newer than steam locomotives was playing a starring role in providing security for the thousands of people who attended the three-day Golden Spike Sesquicentennial Celebration and Festival in Ogden: GIS software and services from Esri.
The Ogden City Police Department used ArcGIS Online, Esri Story Maps apps, Operations Dashboard for ArcGIS, and Survey123 for ArcGIS to help manage and oversee various aspects of security, emergency operations, traffic, and even an event-related drone flight. ArcGIS was mainly used to help plan security for Spike 150 and provide real-time situational awareness during the event. One of the ArcGIS Online maps, however, was created for traffic informational purposes and shared with the public via Visit Ogden, the website for the Ogden/Weber Convention and Visitors Bureau.
Forward Thinking
Ogden is experienced in hosting huge events, such as the 2002 Utah Winter Olympics, the XTERRA Pan Am USA Championship race, and the Dew Tour, but Spike 150 held significance in the city that has been dubbed the “Crossroads of the West.” “Ogden is a railroad town,” said David Weloth, director of the Ogden City Police Department Area Tactical Analysis Center (ATAC), which uses GIS extensively in its work.
From May 9–11, a five-block area of downtown Ogden became the backdrop for the Spike 150 celebration. Public safety officials and organizers spent more than a year preparing for the event. Historic 25th Street and another major roadway, Wall Avenue, were completely closed during the event. The footprint was divided into six operational zones, with a minimum of four officers present in each zone at all times.
Managing the security for the event fell on Ogden police chief Randy Watt and his team at the Ogden City Police Department. Watt, a seasoned veteran of the department, looked to ATAC to assist in the preparation and management of the event. ATAC serves as the central nervous system for policing in the community, including surrounding agencies and the hundreds of thousands of citizens it serves. ATAC is staffed by a team of analysts, police officers, and commanders who monitor the pulse of the city through a system of cameras in public spaces, sensor data, and other technology.
ATAC relies on Esri software and services for part of its daily overwatch responsibilities. Weloth quickly realized that web applications could provide comprehensive operational awareness and field capabilities daily and during special events.
For Spike 150, planning began between six to eight months in advance of the event. The City of Ogden’s GIS supervisor Josh Jones worked with Josh Terry, a GIS professional on the ATAC team, to create the apps, though Jones said Terry did most of the heavy lifting. “Our enterprise GIS team did not have to be involved much,” Jones said. They created their own event management layers.”
Using ArcGIS Online, ATAC mapped the location of road closures, vendors, shuttle routes, parking sites, public cameras, portable toilets, aid stations, command locations, fire hydrants, barricades, the triage area, and bomb bunkers. Bomb bunkers are 55-gallon barrels where a suspected incendiary device (if found) would be placed, according to Weloth.
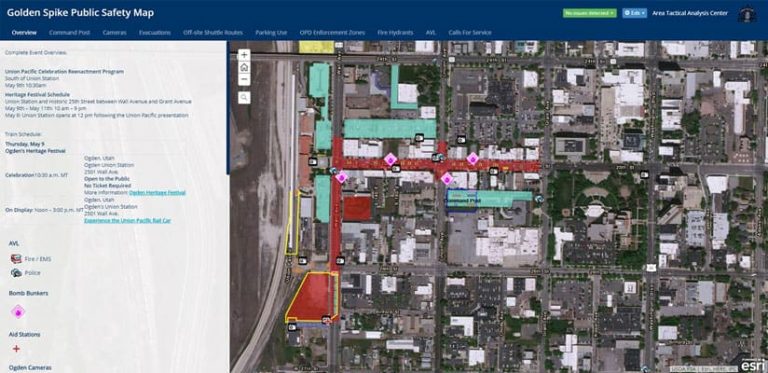
All this information appeared on the Spike 150 Public Safety Map, which was created using the Esri Story Map Series tabbed app template.
Mapping all these locations were essential to creating a highly-coordinated, transparent plan. “It helped us prepare more efficiently and effectively because we could see everything,” Weloth said. “We were better prepared for this event than for the 2002 Winter Olympics.”
Apps Served Many Purposes
An ArcGIS Online map was embedded into an Esri Story Map Cascade app template to create the Emergency Operations GIS Viewer. Live dispatch calls related to the Spike 150 event were pulled into the map via ArcGIS Server, giving the team members in the Emergency Operations Center (EOC) a map that kept them updated in real time on what was happening in the field.
Personnel working the event were assigned 12-hour shifts, and briefings were held twice daily, providing those in the field with relevant updates. Priority data and voice connectivity made real-time situational awareness possible. Along with assigned public safety personnel, the Ogden Metro SWAT Team and the Davis County Explosive Ordnance Disposal team remained on-site throughout the three-day event.
Weloth and the team in the EOC used these mapping applications to help keep track of or shift resources when necessary, such as moving an officer from one operational zone to another. The maps also displayed real-time locations of fire and emergency medical services (EMS) vehicles.

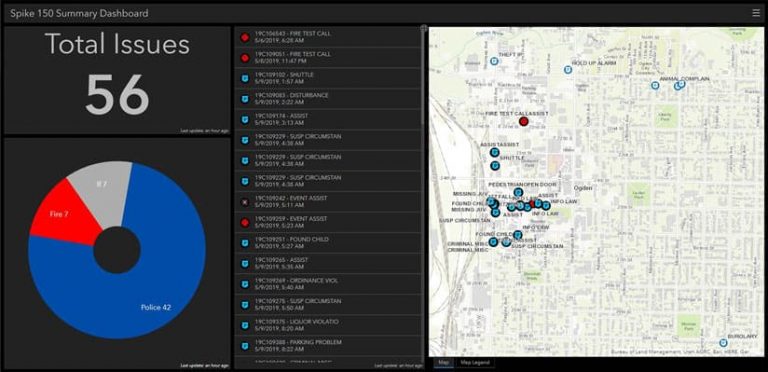
A dashboard created using Operations Dashboard for ArcGIS provided a snapshot of what types of calls officials were receiving in real time. By the time the event had ended, the dashboard had recorded a total of 56 calls: 42 for the police department, 7 for the fire department, and 7 categorized as miscellaneous. Some of the calls included liquor violations, a foot pursuit, a lost child, and public disturbances.
Jones said the dashboard was not only used as a “nifty after-action reporting tool but [also] for officers in the EOC to have a summary of what is happening now.” Again, resources such as police officers could be brought in as needed, or their locations shifted, based on the information the EOC team members saw displayed on the dashboard.
“When you can see something, it [makes] it much more understandable,” Weloth said.
One of the apps created using Esri technology was public facing.
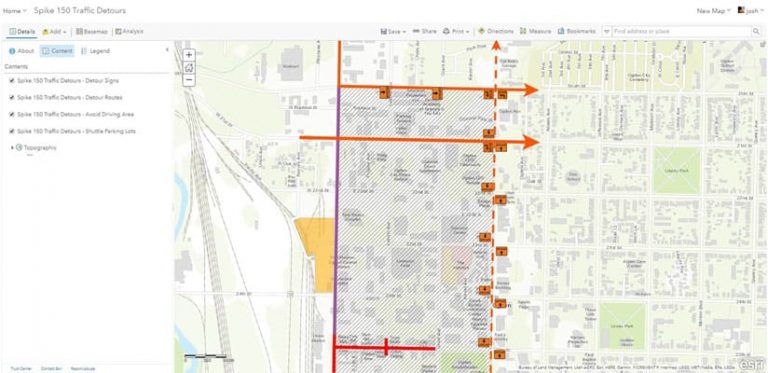
A traffic detour map was created using ArcGIS Online and embedded into the Visit Ogden website, according to Jones. The map gave residents and visitors the ability to see which streets were closed, the locations of off-site parking lots, and where they could catch a shuttle to get to the reenactment event.
Esri technology even played a role in an art project, according to Jones. An artist who was painting a watercolor of the meeting between Big Boy No. 4014 and Living Legend No. 844 in Ogden requested aerial imagery of the location where the two trains would come together.
“Requests for city drone flights are made using Survey123 for ArcGIS forms and routed to the police department for approval via Microsoft Flow webhooks,” Jones said. “Flight planning and record keeping are done via ArcGIS Online and Operations Dashboard.”
All the apps were helpful in managing and monitoring the celebration.
“Event planning was, at times, very fluid, and the dynamic nature of Esri Story Maps, Operations Dashboard for ArcGIS, and other Esri applications enabled us to quickly and easily make changes to support the operation,” Weloth said.
Watch this video to see highlights from the Spike 150 celebration in Ogden.