A New Model for Earthquake Emergency Response
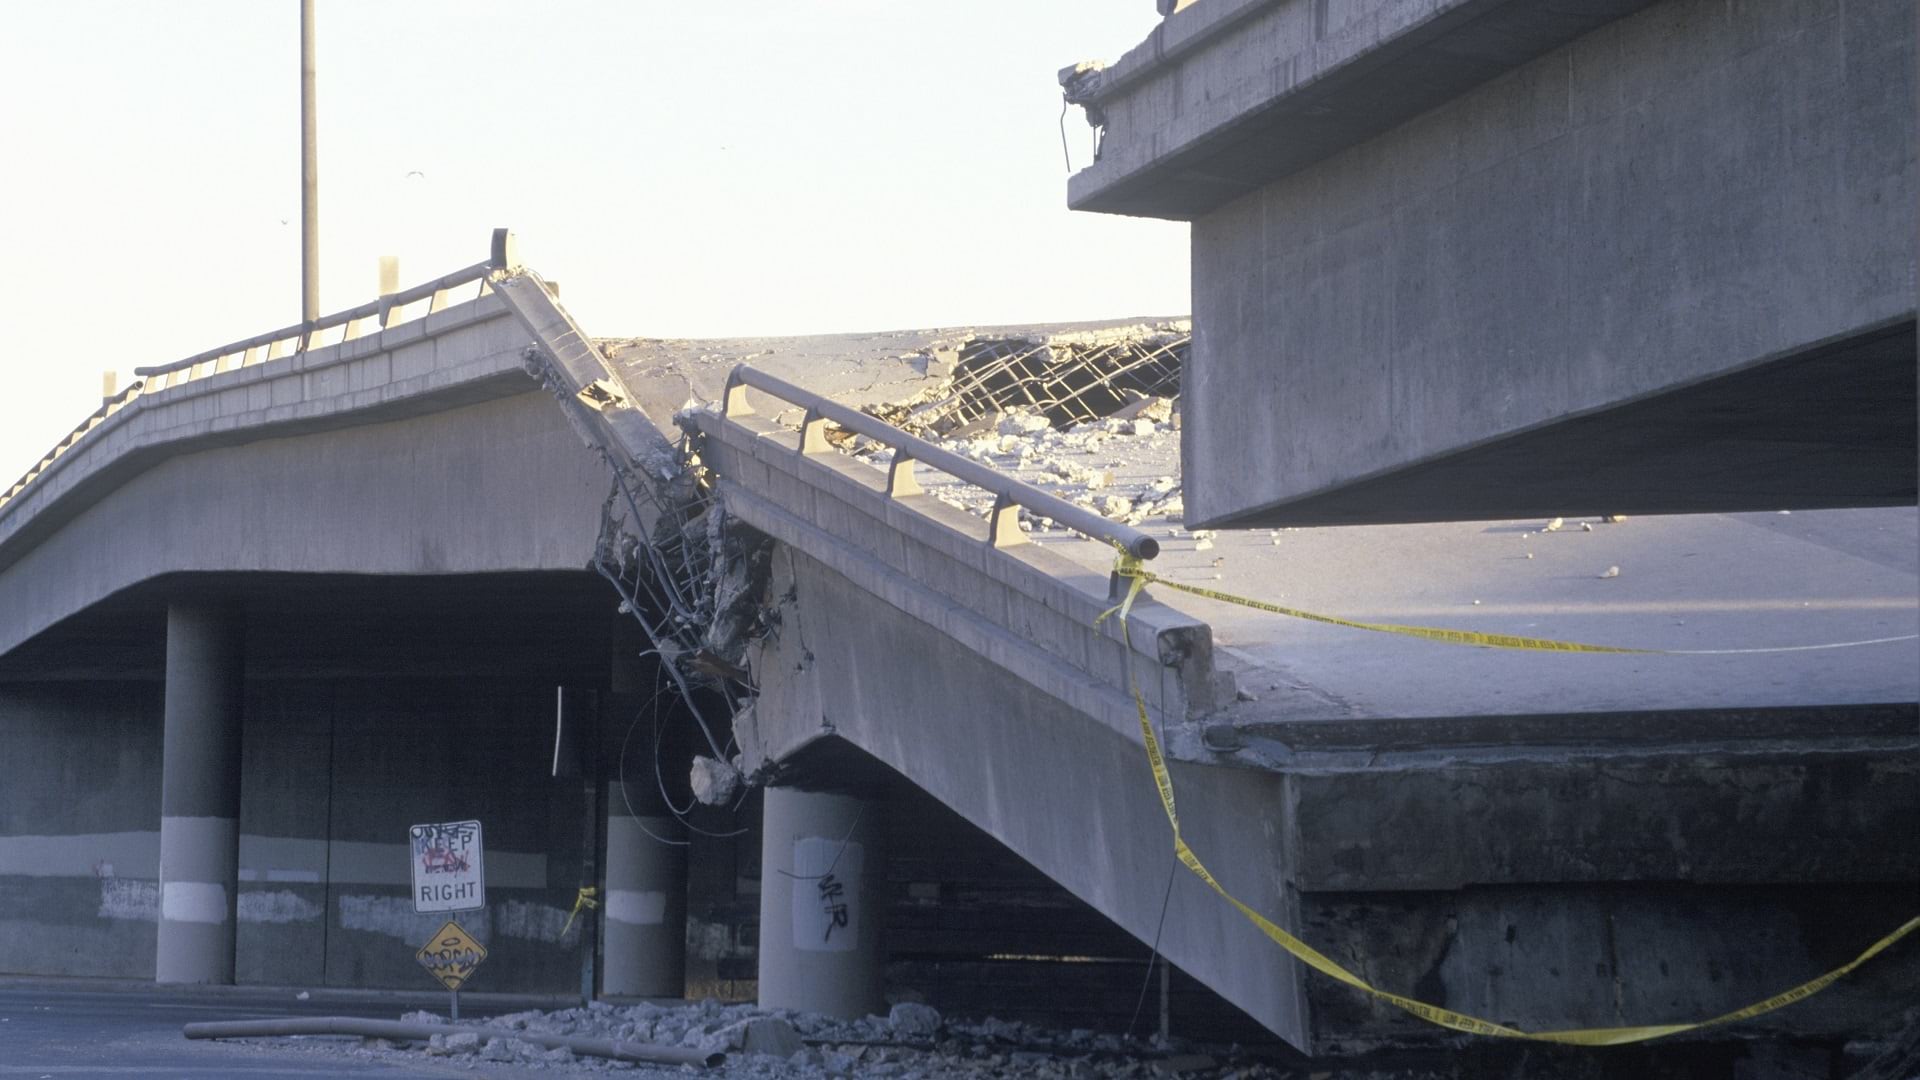
It’s no secret that California is a hot spot of earthquake activity. In fact, the most damaging and costliest quake in the history of the United States, the Northridge earthquake of 1994, was centered in Los Angeles. At least 72 people died as a result of the event, which also caused billions of dollars in damage—estimates range from $15 billion to over $41 billion.
To boot, the United States Geological Survey (USGS) predicts a 31 percent chance that a quake of magnitude 7.5 or greater will strike Los Angeles County within the next 30 years, with catastrophic effects on the region. Estimates from the Southern California Catastrophic Earthquake Response Plan indicate that there will be an initial need for emergency food and water resources to support at least 2.5 million people over an eight-county region in Southern California.
In preparation, Joseph Toland, a graduate student researcher for the USGS, developed the Logistical Resource (LOGRESC) Model for Humanitarian Relief to determine resource requirements for vulnerable populations in the event of a high-magnitude earthquake.
Because communities with fewer resources and poorer infrastructure can be hung out to dry in the aftermath of natural disasters, it’s vital for new models to take them into account.
“Much of the [current] methodology used in estimating emergency food and water needs [is focused on] the restoration and repair of essential utility services,” said Toland. “This approach often leaves out the social implications of extended outages and repairs in vulnerable communities.”
Many factors affect a community’s vulnerability to natural disaster, but communities that already lack or have limited access to stable food and water resources are often overlooked when it comes to emergency response.
“Emergency managers tend to focus on supply-side issues,” Toland explained, “rather than on estimating demand-side resource requirements—which often results in a reactive approach in disaster logistics that disproportionally impacts vulnerable communities when it fails.”
Like all natural disasters, earthquakes can have devastating, unforeseen effects. What Toland needed was a multidisciplinary model—one that considers disruption to utilities and transportation, food and water insecurity, and social vulnerability.
“These areas have all been conceptualized individually,” said Toland. “But [LOGRESC] proposed new ways to connect these disciplines with impacted households in a community. This approach could be operationalized by emergency managers to support the prioritization, allocation, and distribution of emergency resources in a way that has not been done before.”
Building a Framework for Mitigating Disaster
To create this model, Toland used a combination of ArcGIS Pro and ArcMap 10.7, in addition to modeling tools from ArcGIS Spatial Analyst and ArcGIS Geostatistical Analyst.
The key to ensuring a speedy and equitable allocation of resources in the event of a high-magnitude earthquake, however, is accurate and relevant data. This is especially vital for a model that takes so many variables into account.
“My goal in the development of [LOGRESC],”said Toland, “was to integrate the various engineering and socioeconomic challenges that spontaneously occur during a natural disaster.”
To this end, he used publicly available hazard intensity data from the USGS to model the effects of the quake itself, as well as the University of South Carolina’s Social Vulnerability Index (SoVI), which measures the preparedness of US counties for environmental hazards.
Toland also incorporated population data from both the US Decennial Census block group and LandScan USA, a database that provides ambient population estimates. Census data is a common baseline that avoids ecological and scale issues but sacrifices precision in estimating households. LandScan allows the location estimation of households but requires assumptions about ambient populations in relation to these individual households.
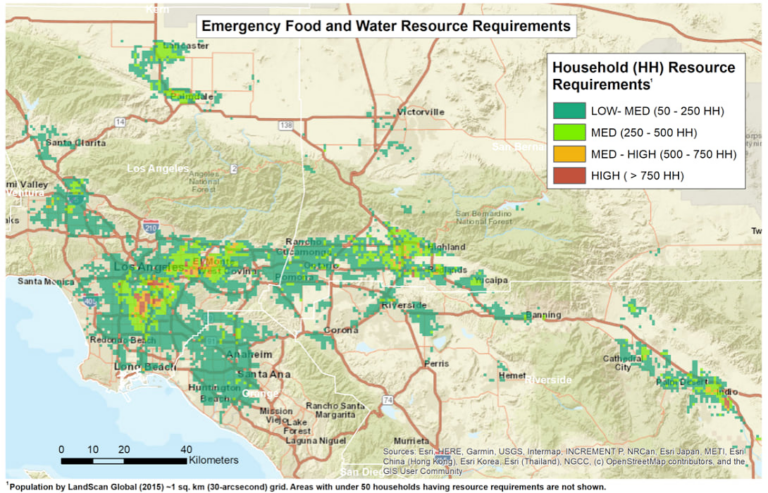
However, the LandScan database provides another essential function to assist in emergency planning and decision-making. “The ambient population model from LandScan allowed me to estimate the physical locations of households that might be impacted in the vulnerability assessment,” said Toland. Information like this is invaluable for emergency managers to identify, prioritize, and allocate resources.
With this data, Toland could then model community vulnerability based on both physical hazards and post-disaster food insecurity, factors that can determine how long communities might take to recover from a natural disaster.
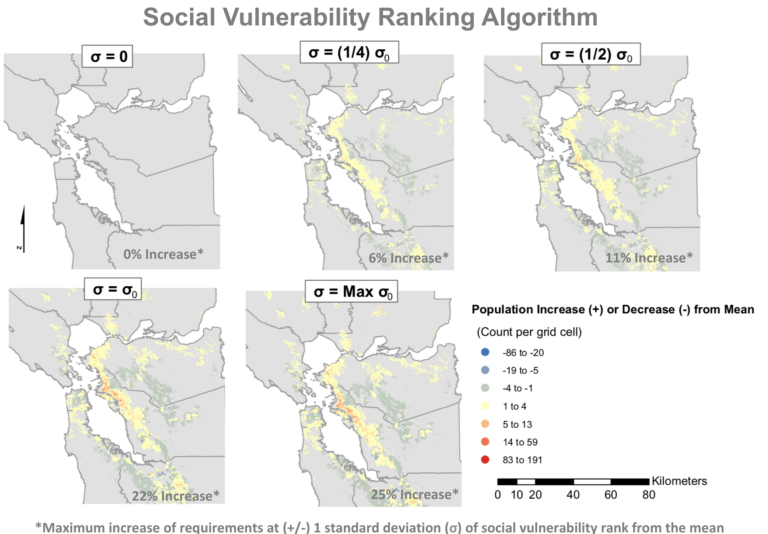
“I used damage and vulnerability functions that allowed me to estimate the percentage of a population subject to utility and transportation disruption,” Toland said. “I then proposed several ways in the conceptual framework to weight those results for socioeconomic factors in underserved communities.”
Mapping the Future of Disaster Response
Although Toland originally built the LOGRESC model to meet post-earthquake needs in Los Angeles County, the model has since been adapted to estimate emergency water supply needs as part of the HayWired scenario, a hypothetical earthquake sequence on the Hayward Fault in the San Francisco Bay Area. It will be officially used in planning the resource needs of more than seven million people in that area.
By providing spatial estimates for emergency water needs in the aftermath of a high-magnitude earthquake, the model allows emergency managers using the HayWired scenario to allocate water resources and prioritize the most severely impacted communities.
“Integration into exercises through our HayWired stakeholder group is the first step in introducing new capabilities with local response organizations,” Toland said. “As part of the HayWired scenario, the model describes one possible outcome—one that emergency managers can use to plan for and exercise around while offering a methodology for rapid estimation of initial resource needs.”
But Toland’s work on this project isn’t done. “I would like to continue to refine the LOGRESC model and expand the way it can be used,” he noted, citing machine learning approaches to synthesize post-disaster food insecurity data. “From those results, I can replace the social vulnerability index currently used in the model with a post-disaster food insecurity component.”
He is also looking into additional data sources to improve the model, including from the emergency response to the COVID-19 pandemic. “This [data] will allow me to validate and calibrate the LOGRESC model with community relief organizations,” says Toland, who hopes to take the project beyond the realm of earthquakes.
“I plan to generalize the model,” he says. “[The goal is to] develop a web-based application framework and decision-support tool for international, multihazard applications in humanitarian relief, catastrophic natural disasters, and public health events.”
