A fisherman casts his net into the South China Sea, as did his father. Here the waves are calm, the waters shallow, and the fish abundant. In the past decade, the fisherman has seen more cargo ships and oil tankers cross his span of ocean, but he is unaware of the risk they bring to his livelihood.
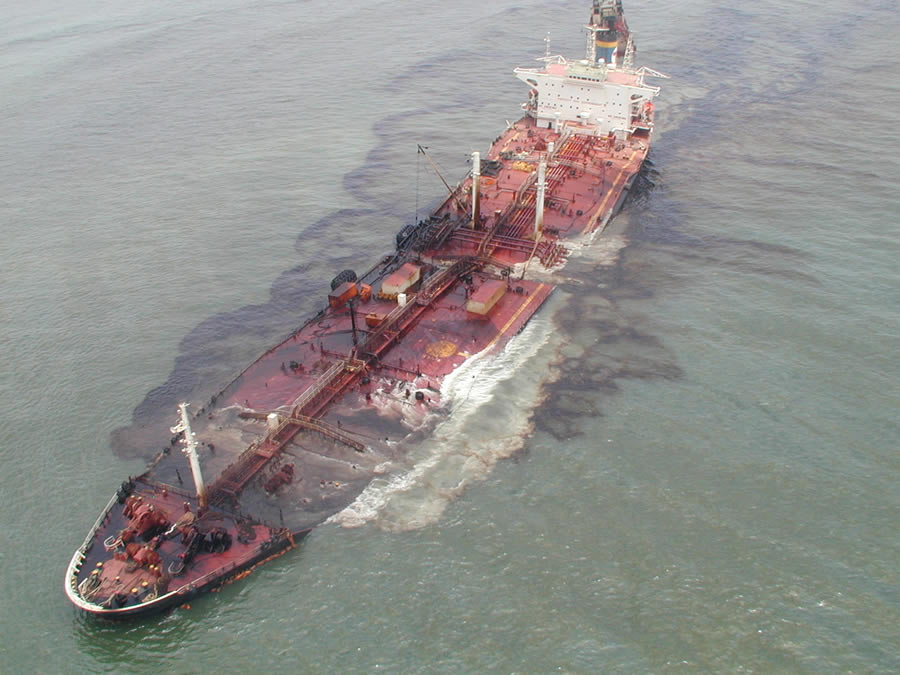
China has huge shipbuilding yards, some of the busiest ports in the world, and a thirst for oil. The majority of oil is delivered to China by tankers coming from Saudi Arabia, Angola, and Iran. Globally, the number of accidental oil spills has continued to decline even though shipping traffic has increased. But the risk of an incident occurring due to factors such as increased traffic, outdated navigation charts, and the number of oil tankers poses a major threat to the ecology and economy of China’s coastal cities.
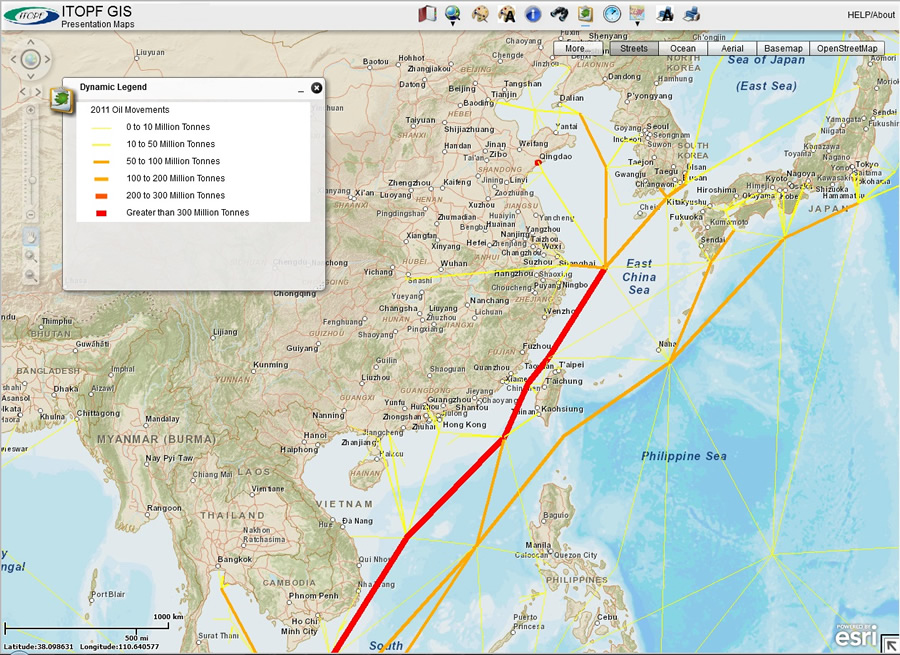
The International Tanker Owners Pollution Federation (ITOPF) uses GIS to create tanker traffic maps showing the risk of collisions and oil spills occurring along shipping routes. Ship owners, coastal communities, and pollution protection and indemnity insurance providers use these maps.
ITOPF has 6,300 members who own or operate about 10,900 tankers, combination carriers and barges, with a total tonnage of 338 million gross tons. This represents virtually all the world’s oil and chemical tank vessel tonnage engaged in international trade. Oil pollution insurers rely on ITOPF experts to assess claims for compensation for oil pollution damage. ITOPF also provides technical information to parties involved in the restoration process.
Medium to large spills caused by collisions and groundings account for 50 percent of tanker spills worldwide, but in China they account for 78 percent. Knowing this, ITOPF is working to build awareness in China about the country’s oil spill risk. It offers technical advice and information about pollution response and the effects of oil spills.
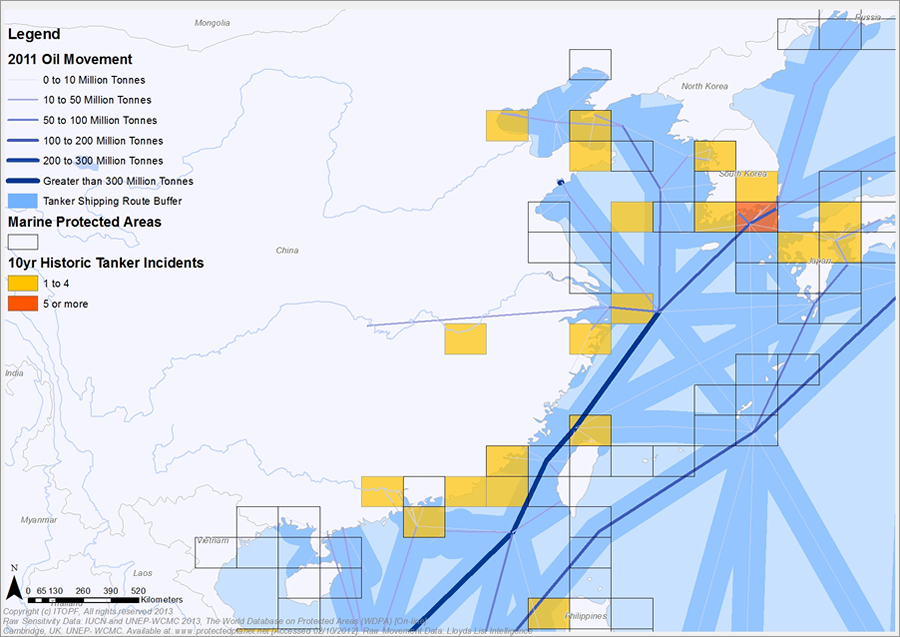
ITOPF’s small response team is always ready to assist at marine spills anywhere in the world. Its researchers analyze seaborne-transport data, such as Lloyd’s List, about tanker types, oil movement, and incidents. Maps combine tanker route information and areas classified as sensitive environments to show the ecological disaster potential. ITOPF hopes the information will persuade local governments to be ready for spills by creating disaster preparedness plans and maintaining a cache of shoreline cleanup equipment.
At one time, the organization’s researchers manually processed sea transit data to create risk maps. Senior technical support coordinator at ITOPF Lisa Stevens and consultants from Makina Corpus, a web applications design company, created a geoprocessing routine that speeds the process of mapping oil tankers’ journeys.
“Maps tell the story,” Stevens said. “The analysis is not complicated, but GIS makes problem areas obvious.”
Schematic Maps
ITOPF uses Esri ArcGIS to create schematic maps that show how much oil is transported along any particular coastline and shipping route and publishes them on its website (see figure 1). Map data includes tanker and vessel types, tonnage, and the number of journeys. In addition, you can see a geographic history of major tanker oil spills since the 1970s (see figure 2). Adding data from the United Nations Environment Programme (UNEP) about the world protected areas to the map, along with tanker traffic over or near these areas, makes for a strong visualization.
Stevens added widgets to the web maps so her colleagues who are not GIS professionals can easily create maps, print, and go. They use these maps during presentations to local governments and other interested organizations to show areas of potential risk.
“Some countries don’t know the amount of oil that is going past their coastlines and its potential threat,” Stevens noted. “Seeing this geographically helps people realize the scale of the risk and that they need to be prepared with contingency plans and equipment stockpiles.”
Objective Technical Advice
Whenever and wherever oil spills occur, ITOPF technical advisers use GIS as a tool for providing objective technical advice. Suppose a tanker runs aground off the coast of our fisherman’s South China Sea province and oil begins to seep into the water. At the ITOPF office in London, scientists create and publish a GIS web map that highlights the sensitive areas near the ship.
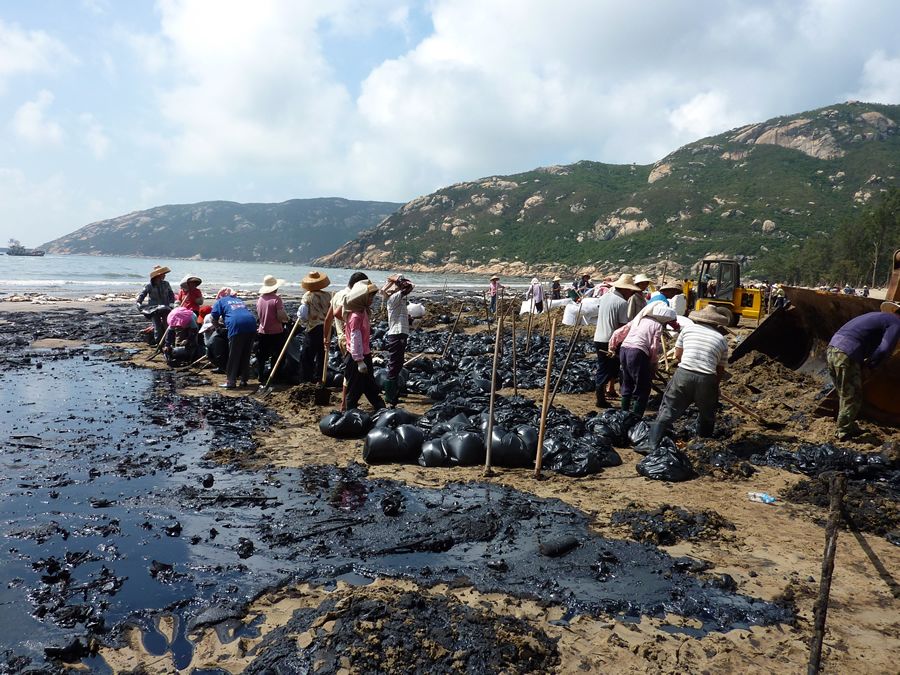
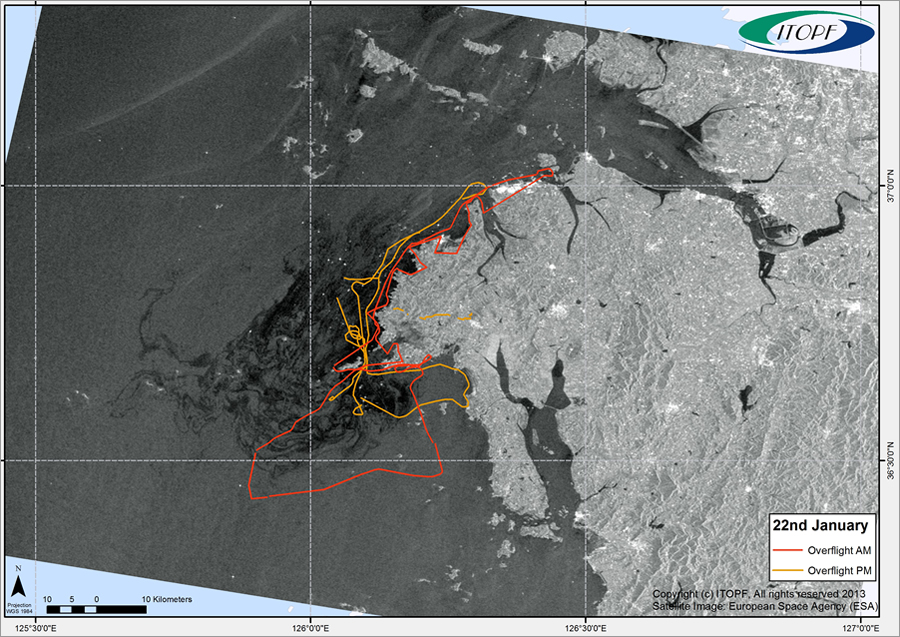
Once technical advisers arrive at the scene, depending on the available infrastructure, they instantly access basic GIS maps that show sensitive areas and reference oil spill case histories. Everyone involved in the incident sees the same data published on the GIS server. The map interface links to information so users can access information about key organizations involved in similar cleanup operations, review their efforts, and meet with them to discuss the response plan. Furthermore, ITOPF puts reconnaissance efforts into a geographic context by mapping the routes of surveillance flights over the spill site.
GIS presents information in a way that educates thousands of ITOPF members and helps them prepare for oil spills. They can see the amount of oil tonnage and journeys in areas that their own vessels travel in and consider their preparedness plans should an incident occur in those waters. Moreover, countries whose shores are at risk for an oil spill can design response plans that will address local needs.
