Does your organization need to monitor events in real time to coordinate a response to a natural disaster or handle day-to-day operations? Do your field crews need to capture spatial or tabular information with smartphones and send the information back to office headquarters?
Esri’s new Operations Dashboard for ArcGIS and Collector for ArcGIS apps do these things and many more. These apps work well with both spatial and attribute data that streams through ArcGIS GeoEvent Processor for Server, now in beta. ArcGIS for Server feature services can also be used as data sources when using ArcGIS 10.1 or later. Operations Dashboard for ArcGIS requires an ArcGIS Online organizational subscription or free 30-day trial.
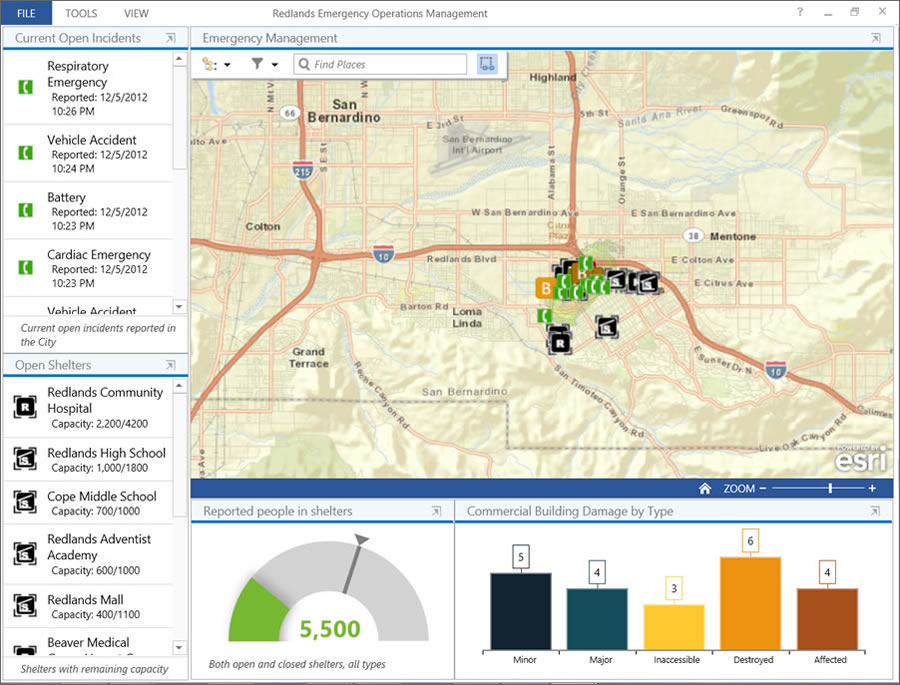
Operations Dashboard for ArcGIS offers a common operating picture (COP) to better monitor and respond to events in real time. You can author an operation view with the app and configure it to include your maps, widgets, lists, bar charts, histograms, gauges, and other performance indicators that receive live data feeds.
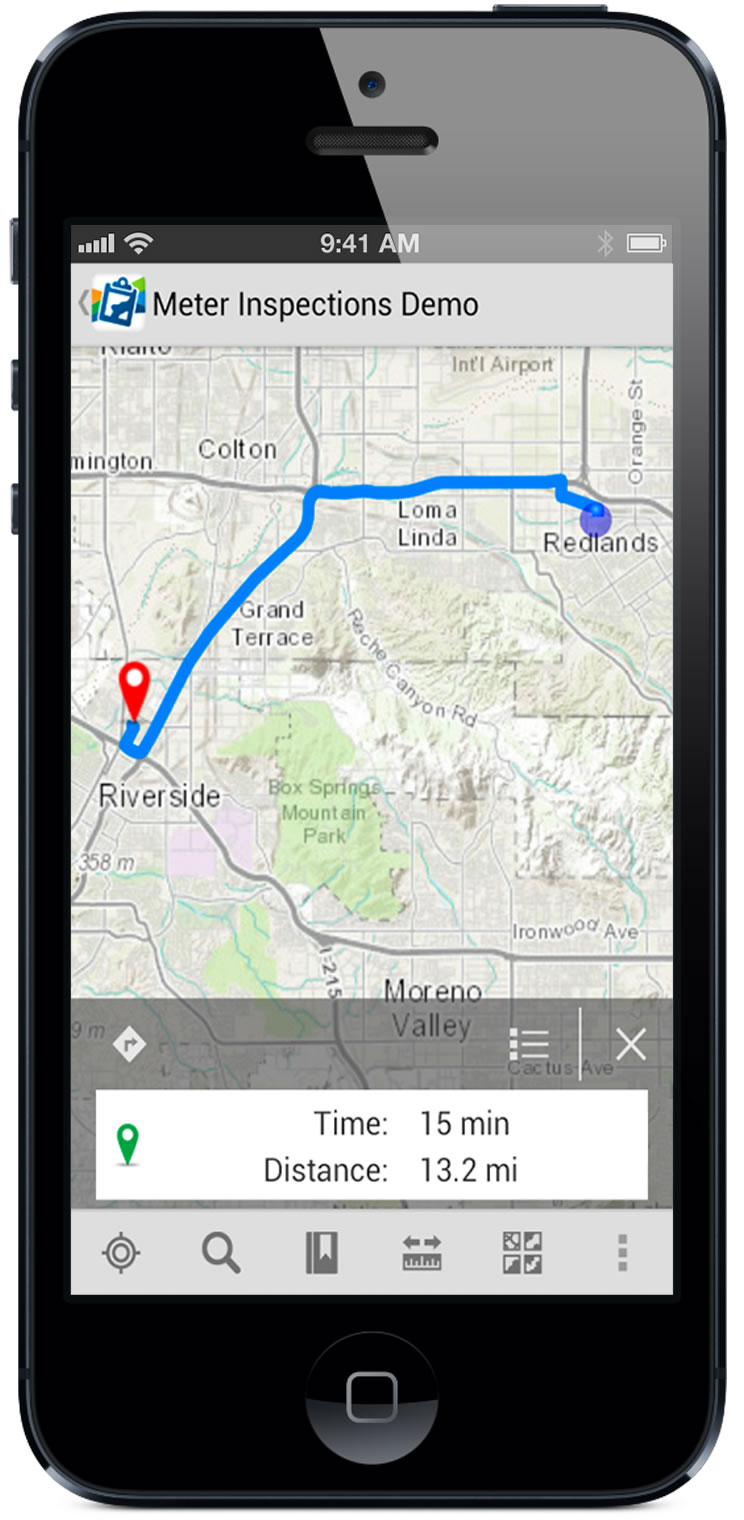
Some of the data displayed on the dashboard can come from field crews gathering information using Collector for ArcGIS, which is designed specifically for iPhones and Android smartphones and provides an intuitive data collection experience. Workers can download maps with the Collector app and then capture spatial and tabular data using the phone’s GPS or by tapping on the map. The Collector app lets them do the following:
- View and interact with maps
- Find places, get directions, and plan routes (point-to-point routing)
- Report the location of you and your vehicle to office headquarters
- Download basemaps
- Edit and update map features
- Enter form data
- Attach photos and videos

The data collected using the Collector app can then be transmitted and immediately shared with office headquarters in real time. Information streams back into Operations Dashboard for ArcGIS and appears within the operation view of your configurable dashboard.
The operation view can then be shared with colleagues, including managers who need to make decisions regarding the operation or event. How would this work in a real situation, such as after a large earthquake in a community in Southern California?
Staff at a government Emergency Operations Center (EOC) could author an operational view that maps the location of fire trucks, law enforcement vehicles, and ambulances and reports of traffic accidents and medical calls. For example, a 911 call about a man who fell and broke his leg could be mapped, and information about the incident, such as the date, time, and victim’s condition, could be added to a pop-up window.
The EOC staff could consult the map, see the location of the closest available paramedics, and send that crew immediately to the scene. One of the paramedics, using Collector for ArcGIS, could provide updates about the man’s condition. That information would automatically appear in a pop-up window on the map or in a list on Operations Dashboard.
Field-workers assessing earthquake damage to houses could gather and report that information via Collector for ArcGIS. Damage assessments could be transmitted to a municipal agency and appear on another operation view created using Operations Dashboard for ArcGIS or be integrated into a city’s GIS.
The Operations Dashboard for ArcGIS application is available for use on Windows desktops and Intel-based Windows 8 tablets. It includes messaging integration via an Extensible Messaging and Processing Protocol (XMPP) hosting server, such as Microsoft Lync, and map markup/sketching capabilities that can be used inside the application.
You can use the Dashboard app on a Windows desktop to create and manage a COP that can be shared and used by others within your organization. In a typical operations center, the Dashboard app running on Windows desktops takes full advantage of multiple monitors and large screens used for monitoring a system or event.
Executives and specialists who need to make critical decisions and communicate with field personnel can see a view of the operation on either a large monitor in the operations center or a single desktop monitor or use the Dashboard app inside their Windows tablet device.
Operations Dashboard for ArcGIS is a self-updating Windows app that you can install directly using a click-once link within your ArcGIS Online organization without the need for administrator rights. It is powered by ArcGIS Runtime SDK for WPF, and developers can extend the Dashboard by creating new widgets and map tools.

