Data Plus GIS Equals Help for Homeless Students
A New York City-based nonprofit group uses Esri technology to analyze data on homeless children, producing maps and infographics intended to inform policy and steer resources to areas where the need is great.
The Institute for Children, Poverty & Homelessness (ICPH) uses ArcGIS Desktop and ArcGIS Online in its research, analysis, and presentation of data related to childhood homelessness. ICPH publishes the information, including the maps, in reports such as On the Map: The Atlas of Student Homelessness in New York City 2018.
More than 2.5 million children are homeless in the United States, according to the National Center on Family Homelessness, part of the American Institutes for Research. That represents 1 out of every 30 children in the country, and they are found in every city, county, and state.
In urban areas, the numbers are much greater.

“There are about 1.1 million school age children in New York City, and more than 1 out of 10 of them [are] considered homeless,” said Aurora Zepeda, chief operating officer for ICPH, which is headquartered in the city.
New York City’s public school system is the largest in the world. It includes more than 1,700 schools, which are divided into 32 community school districts for elementary and middle schools and 5 districts for high schools.
To help guide policies, ICPH studies the data available on homelessness among students in this vast school system. The basis for federal government support for homelessness initiatives is the McKinney-Vento Homeless Assistance Act of 1987. The act defines homeless children and youths as individuals who lack a fixed, regular, and adequate nighttime residence.
Taking a Comprehensive Look at Homelessness among Children
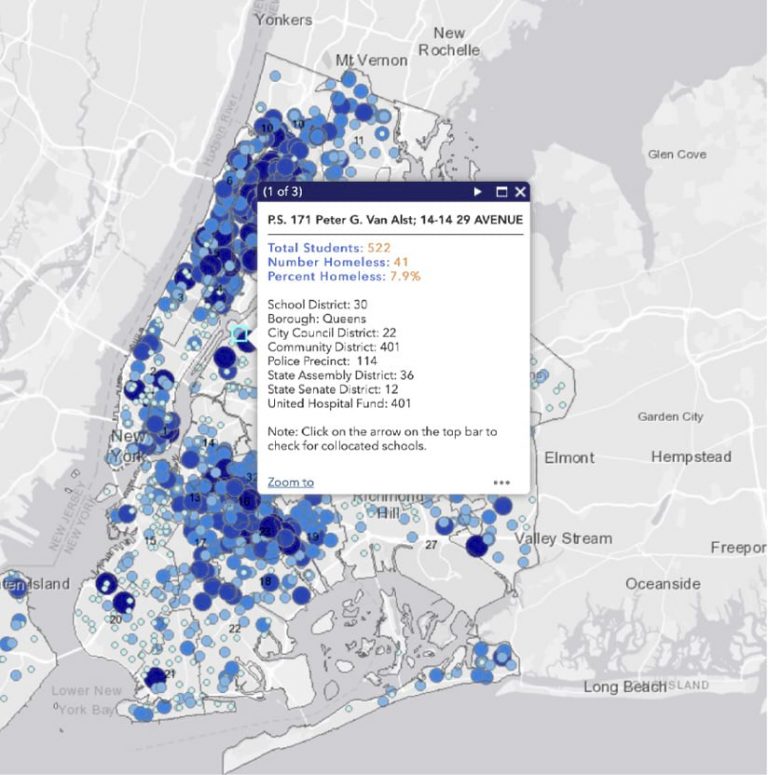
Among the ICPH’s primary publications is the Student Homelessness in New York City series. This resource provides a detailed picture of homelessness, with maps, charts, graphs, infographics, and statistical information. It includes an array of information about all the school districts and is updated annually. It is supplemented by the New York City Interactive Map of Student Homelessness, which ICPH published via ArcGIS Online.
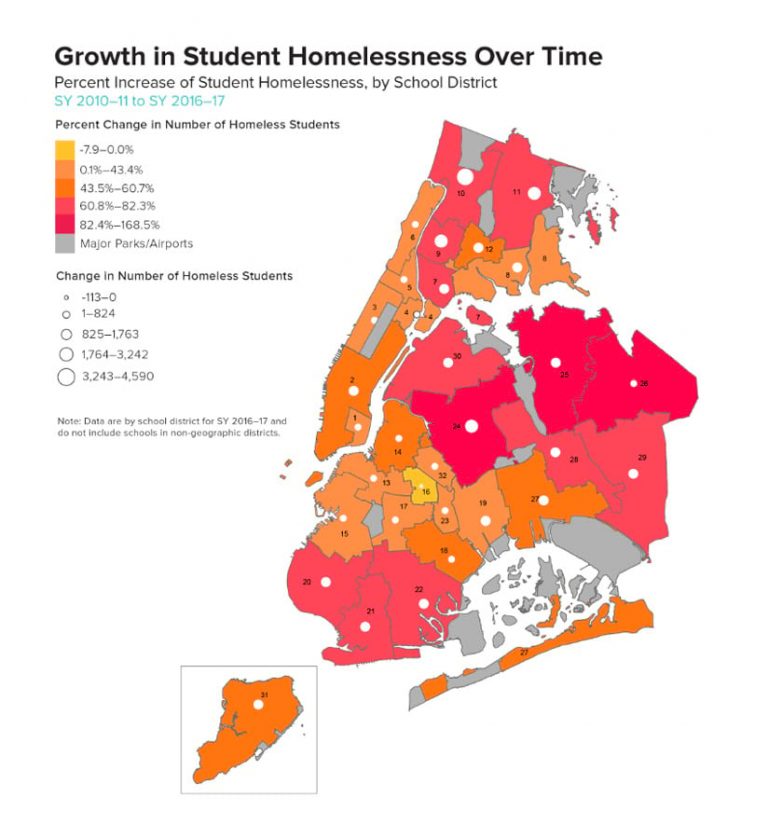
One map produced by the ICPH shows, by percentage, the growth in student homelessness between the 2010–11 and 2016–17 school years. In some parts of the city, the percentages jumped during that time by more than 80 percent, according to the data published in the map.
The Student Homelessness in New York City series also includes the overarching characteristics of the city’s homeless students (see the ICPH web page What You Need to Know about NYC’s Homeless High School Students for examples) and the citywide trends that are important in developing policies and programs for them.
The publication also provides information about the geographic distribution of homeless students across the city and how educational outcomes vary within each school district. One statistic cited in a report, for example, is that nearly one in six homeless students dropped out of high school before graduation. In its publication, the ICPH offers an in-depth examination of student homelessness in each school district.
“The information we provide in Student Homelessness in New York City is used for planning and prioritization at the local, district, and citywide levels of New York’s public school system,” Zepeda said.
The operational layers for the ICPH’s New York City datasets include homelessness in New York City public and charter schools, along with shelters, community resources, affordable housing, and municipal boundaries. The data comes from the US Census Bureau, the National Center for Educational Statistics, New York City Department of Education, and various other agencies in New York City.
New York City Department of Education provides access to anonymized student-level data for all children attending the city’s public schools. This data is recorded at the end of each school year and is linked to annual student housing status information through a unique scrambled student identifier. All students are geocoded based on their last school of enrollment and their school district number.
“When you add the analysis and mapping capabilities of GIS to the evaluation of homelessness, you can more easily identify the areas that can benefit from allocated resources and targeted campaigns, and subsequently provide better support to those students that are homeless,” said Kristen MacFarlane, former senior GIS analyst, ICPH.
“Interestingly, you can find schools that are near one another that have completely different homeless [student] profiles,” she said. “That is, one school may have a relatively low number of homeless students while the other has a much higher number. This can be due to different factors, such as community redevelopment, gentrification, or the segregation of a neighborhood by major thoroughfares running through it.”
Using Evidence-Based Information to Reduce Homelessness
ICPH is an independent public policy research organization. Its mission is to bring family and child homelessness into focus through research, policy briefs, and interactive data tools, and to promote a robust, evidence-based dialogue on the challenges faced by homeless families and children.
Analysis has determined that the stress of the uncertainty created by homelessness—together with other factors that correlate with the experience of housing instability—can greatly affect a student’s educational outcome. For example, homeless students are much more likely than their classmates to transfer schools, be chronically absent or suspended, drop out of school, have lower proficiency rates on state assessments than non-homeless students, or have special education or English language learning needs.
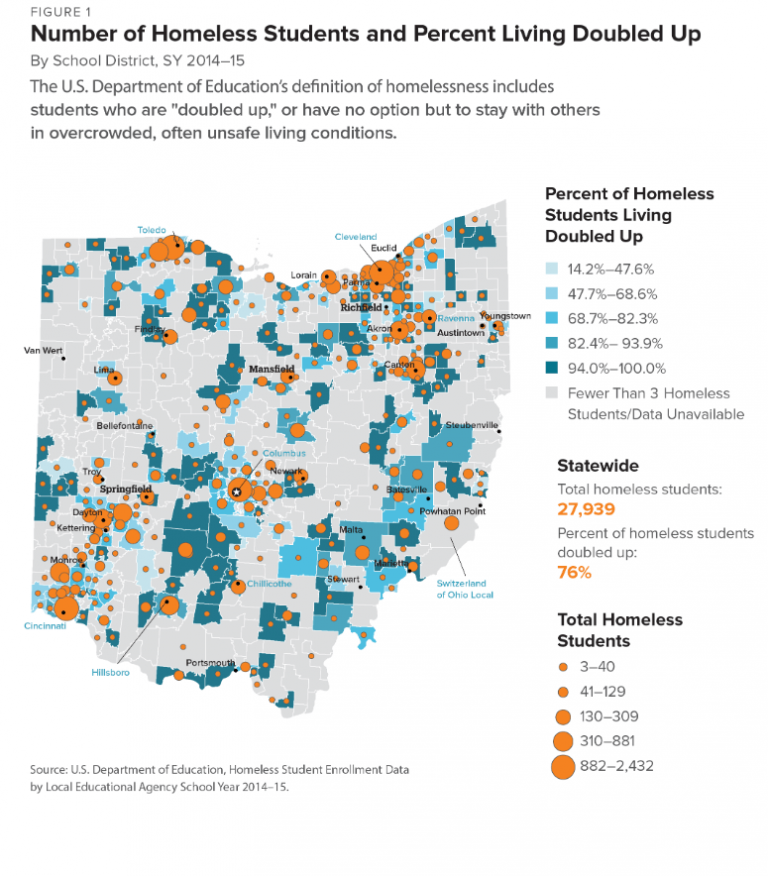
“We believe that, at its root, student homelessness and the resulting educational obstacles should be addressed at the local level,” Zepeda said. “So we use a variety of data, including geospatial data, in our publications to inform local agencies and the public about the effects of child and family homelessness so that it is actionable. We are a policy research group that focuses on homeless children and their families because they are the hidden homeless. That is, they are more likely to live doubled up with friends or family, making it harder to account for them and provide them with necessary services.”
ICPH also produces a nationwide, state education snapshot series. “In this project, we’re looking at the school districts of each state,” Zepeda said. “It is a complex project because school districts can overlap in some states. Essentially, we are examining different subgroups among homeless schoolchildren—such as those with disabilities—to help inform local school districts and the state and federal governments regarding the need for support and the allocation of educational funding.”
Education is critical to overcoming homelessness.
“We have found that homelessness is a pervasive issue,” Zepeda said. “It is found everywhere and impacts everything, but education can break the cycle of poverty and homelessness. Our goal is to provide definitive statistical information in an understandable way so that decision-makers can use it to help homeless students achieve their full potential.”
