City of Melrose, Massachusetts, Shares Data and Resources via an ArcGIS Hub Site during the Pandemic
Though its impact on large cities such as Los Angeles and New York City is often in the headlines, small communities also are bearing the brunt of the coronavirus disease 2019 (COVID-19) pandemic.
One such place is the city of Melrose, Massachusetts, a quaint suburb located seven miles north of Boston. With stunning nature preserves, historic architecture, and charming neighborhoods, Melrose offers its more than 28,000 residents an idyllic setting to live and work in.
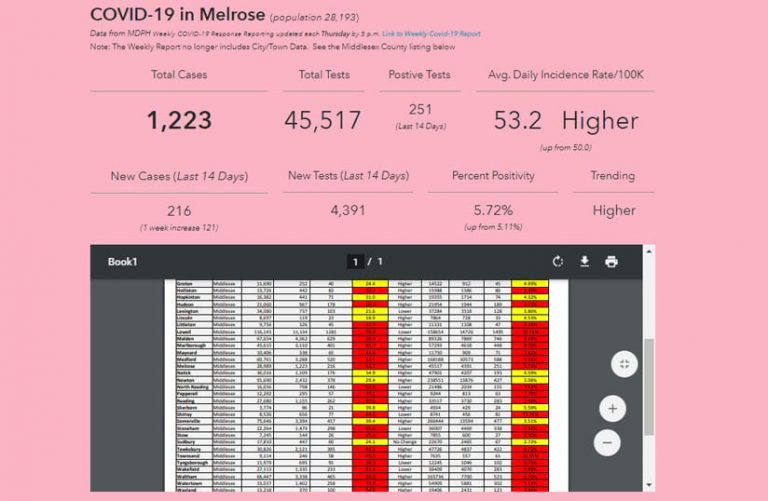
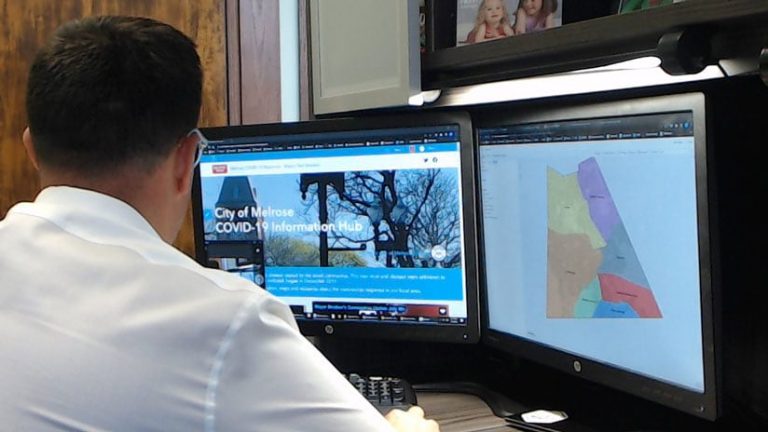
More than 1,400 cases of COVID-19 have been reported and confirmed in the city through late January 2021, with more than 230 positive tests recorded during a 14-day period from mid- to late- January. Melrose has been well prepared for the crisis, however, thanks in part to the online City of Melrose COVID-19 Information Hub, created with ArcGIS Hub from Esri. The Information Hub site was launched in April 2020.
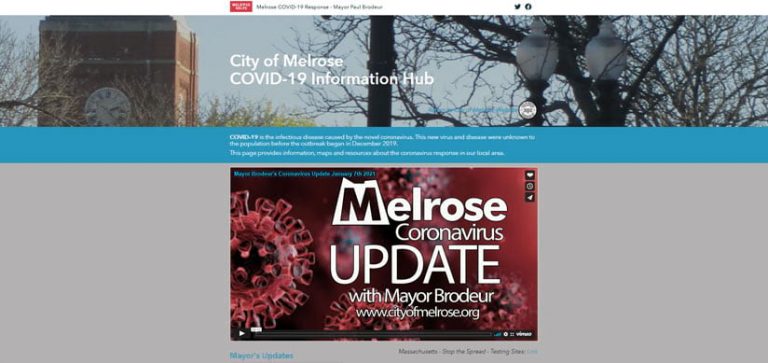
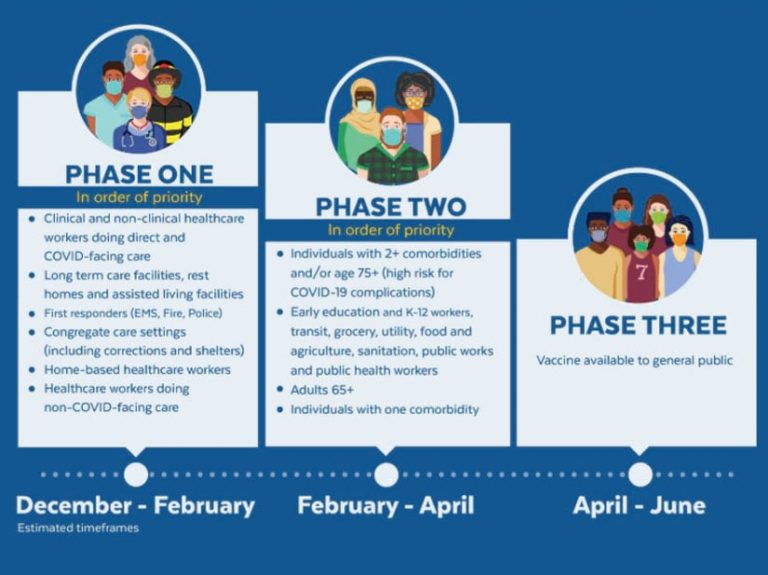
On the Hub site, residents will find helpful resources such as the latest local and statewide data on COVID-19 cases; data on testing in Melrose, including the numbers of positive tests; maps that show confirmed and probable deaths from COVID-19, by county, throughout the state; and an interactive data dashboard from the Massachusetts Department of Public Health with information on numbers of cases, tests, hospitalizations, and deaths statewide. Also included are graphics that display the numbers of people tested statewide; links to COVID-19 testing sites; and videos from Melrose mayor Paul Brodeur, who provides updates such as news about contact tracing, testing, and vaccinations. Viewers will also find a symptom checker as well as a section that details the four-phase plan for reopening the state.
“ArcGIS Hub offered the best way for us to communicate with the residents of Melrose by using easy-to-follow data graphics and relevant data,” said Christopher Wilcock, chief assessor and director of GIS for the City of Melrose. “With minimal resources and a small team, we were able to quickly set up an informative Hub site for our community.”
Communication Was Critical
At the beginning of the pandemic, Melrose city officials quickly prepared for the emerging crisis. The ability to communicate timely information effectively is an important tool in the fight against COVID-19, and the City of Melrose wanted to provide residents up-to-date information on the pandemic to protect residents and keep them healthy and safe.
Local officials set out to create an informational website for the public. The team implemented a new solution: ArcGIS Hub community engagement software. The software gave the city the ability to effectively share vital resources—including statistics and COVID-19 prevention tips—with Melrose residents. With a small team and limited resources, the City of Melrose created a site that has become a trusted source of information for the town.
The primary goal of this project was to build an information web page for the city’s mayor to communicate to all Melrose residents during the COVID-19 pandemic. According to Wilcock, the idea was to combine statistics, updated videos, educational information, and self-help tools for residents to navigate the pandemic.
Wilcock says the current city website software had limitations on design and functions. As such, the city GIS team searched for a new solution that was easy to configure and could add dynamic features such as interactive maps.
“At the beginning of the pandemic, there was a need to help the city get information out in a more visual, user-friendly, and dynamic way,” said Jane Pitts, GIS analyst for the City of Melrose. “Our city’s current website is full of text and hard to navigate for the user.”
Wilcock says the GIS team was brought in to work on an information hub in March 2020 and organize the COVID-19-related statistics, videos, charts , and other data from multiple external sources. The ArcGIS Hub site went live on April 11, 2020, and has received more than 25,000 views so far, Wilcock said.
The goal was to keep the information current on the site, stay fluid, and continue to add new content as it was made available. The team began the project by discussing all of the available data and COVID-19 content that they could use.
“Our job with the site was to have people informed with the numbers, [tell them] where they could get help if they needed, and also to comfort them a little with a message from the mayor that’s relevant every day,” said Wilcock.
ArcGIS Hub Fit the City’s Needs
The city’s GIS team selected ArcGIS Hub to create its informational web page. ArcGIS Hub is cloud-based engagement software that allows organizations to work more effectively with their communities. Pitts, an Esri software user since 2001, chose Hub because it would allow the team members to create a dynamic site and cater the solution to their community. “We evaluated every piece of software that the city had in place, and in our opinion, ArcGIS Hub was the only product that could get it done quickly and efficiently,” Wilcock said.

Pitts says that she received an invitation from her local Esri regional office to attend an ArcGIS Hub webinar, which taught her how to use the new Coronavirus Response template. The template enables organizations to add their own branding, resources, and data regarding the COVID-19 outbreak to a web page.
“It was a great product to work with. In hindsight, the timing [of the webinar] was perfect,” said Pitts. “I thought Hub was the best solution for informing the public.”
he webinar also directed her to view a gallery of other community Hub sites from the United States and Canada for inspiration. Wilcock and Pitts spent a lot of time looking over other state, county, and local government Hub sites, then reassembled the ideas they saw into a format that suited their city.
“I think that’s a great thing for collaboration in small cities to get things done fast and efficiently,” Wilcock said. “We don’t necessarily have a lot of time, so if we can find something that’s working in another community and modify it, that’s a lot easier than starting from scratch.”