In March 2019, during a brutal winter of unrelenting snow, wind, and unseasonable temperature cycles, the roof of Montana State University’s south gym failed under the weight of the accumulated snow and ice. Fortunately, because the roof collapsed late at night, no one was injured. But despite the gym’s construction dating back to the 1970s, no one had expected it to sustain this level of damage.
Two days later, the north gym’s roof followed suit. This time, engineers had predicted the collapse, and in preparation, the university was able to close an adjacent street and isolate utilities to the gym. Even so, it must have been a shock to see the huge, blocky buildings torn open at the seams, snow piled up in drifts against the walls.
MSU, acting on the guidance and expertise of engineers, quickly began removing snow from other campus buildings. But this only solved the immediate problem. The question left hanging in the air was what would happen when Montana next saw similar—or worse—winter conditions.
Eric Sproles, assistant professor in the department of earth sciences at MSU, saw an opportunity to bring his geospatial technology expertise to the table. Once the urgency of the snow removal response had died down, he contacted MSU facilities with a proposition: to make maps of rooftop snow load.
“As someone who measures snow for a living and thinks about new ways to measure snow, I [knew] we could get up there,” said Sproles. “We could map depth, and from there we could extrapolate density, and from there we could extrapolate snow loads.”
The goal was to be able to collect and visualize more accurate data about how much snow was too much for campus buildings to handle, in hopes of eliminating the financial—and possibly human—cost of another roof collapse.
Gathering Data from the Top Down
Creating an effective monitoring method for rooftop snow loads was a two-stage process. First, Sproles needed to collect data not just about snow density, but also about how much each structure could handle before collapse. After that, he would need a way to communicate that data to facilities and administrative staff so they could use it to mitigate future snow-related incidents.
Luckily, there were plenty of undergraduate students at MSU eager to cut their teeth on a project where they could apply their GIS knowledge in the field.
“I was one of two students who started out on that project,” said Maddie Beck, a former MSU student who graduated in the spring of 2021 and now works as a ski patroller at Bridger Bowl Ski Area. “That first season was a lot of troubleshooting and trying to figure out how to get everything to work.”
The first step was installing rooftop snow scales—aluminum plates that measure the weight of snow and allowed Sproles to calculate snow density. However, Sproles and his team of undergraduates soon began using drones to collect additional data. With drone imagery, they could use digital surface model subtraction in ArcGIS Pro to measure the depth and density of rooftop snow loads.
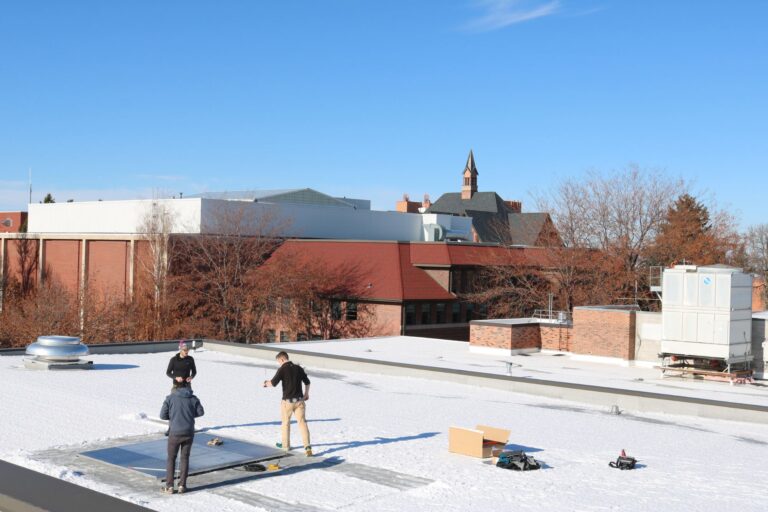
“The first year we just did static maps,” said Sproles. “We wanted to make sure we were getting the measurements right before we moved on to the interface.”
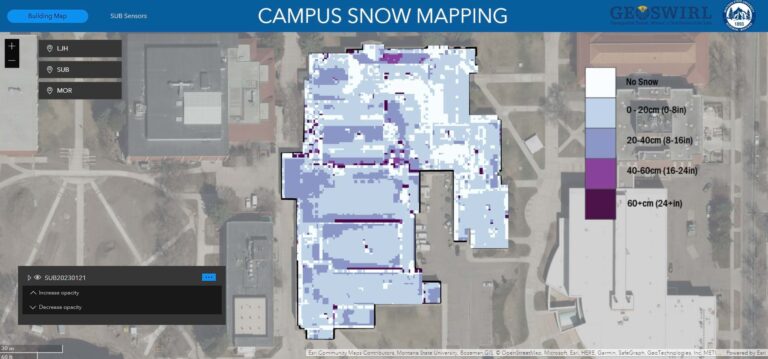
After collecting enough data from drone imagery—as well as measurement units placed inside at-risk buildings to measure how snow load changed internal load-bearing structures—the team began to input that data into a visual format using ArcGIS Web AppBuilder.
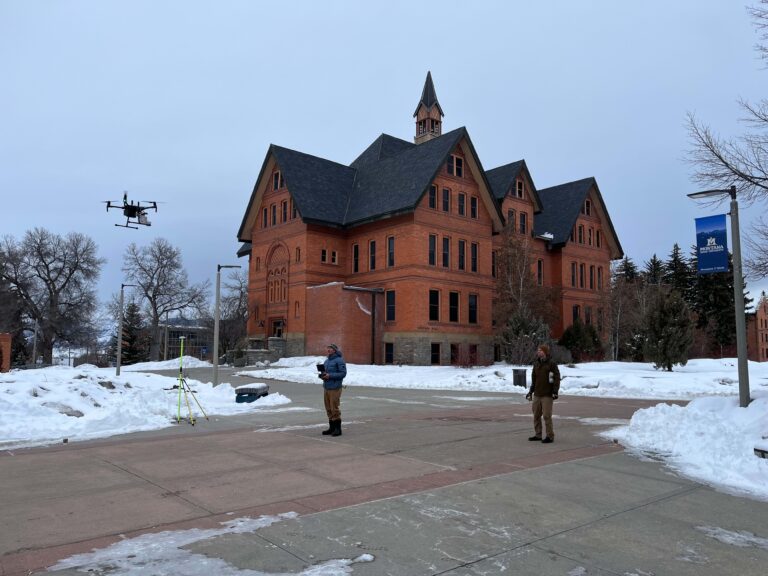
However, the project soon underwent a transition in how team members gathered drone data, as they began using lidar to speed up the process.
“With lidar drones, flights that used to take about four to five hours now take an hour and a half,” said Sproles. “Lidar is that much faster.”
Likewise, a shift from ArcGIS Web AppBuilder to ArcGIS Experience Builder helped create a more comprehensive platform for viewing and analyzing snow load data.
“Experience Builder has been awesome for employing different visualization methods and ways to flip back and forth between different data sources, like lidar imagery and the flexion sensors installed on the roofs of the buildings we’re responsible for monitoring,” said Niko Hinz, an undergraduate geography student currently working on the project. “[It’s] a simple web page to navigate, that we’ll be able to turn over to the facilities folks at the university.”
“This project only really does something and means something if others can learn from it, and if others can see the work that we’re doing,” added Beck. “[We can] use [ArcGIS] StoryMaps and an ArcGIS Online account to relay that information to the facilities crew at our university with the hope that with that information, the facilities crew can better understand when it might need to clear snow.”
Costs and Benefits
Not only is this a replicable project that makes the university campus safer, but having snow load data in an easily communicable format also comes with additional, lasting benefits.
“We’re creating a long-term record of simple climate variables, how snow is changing or isn’t changing,” said Sproles. “We don’t [yet] have a big body of data to work with, but we’re able to see how the flexion of roofs changes with pounds per square feet [of snow]. And if climate projections are true, we’re going to have heavier snow. What was a foot of snow in 1988 might have a different weight than a foot of snow in 2028.”
By tracking these changes, this project could allow the university to accurately predict the cost of snow removal in future years so it can allocate funding more efficiently. Furthermore, projects like this are a boon for undergraduates looking to get into the field of geospatial science.
“They’re developing real-world skills like project management,” said Sproles. “It’s a great formative experience for the students to [engage in] hands-on geospatial work and interface with a client, which doesn’t always happen in undergrad.”
Hinz noted that the project was not only a way for students to expand their geospatial skillsets, but also a fantastic example of GIS as a method of visually conveying vital trends and phenomena to people who can act on them. “You can communicate so many different things,” he said. “There are so many possibilities to use these skills in the professional world.”
“With any problem, there can be many creative solutions that aren’t apparent from the start,” added Beck. “If you talk to different scientists in different fields, you’re going to get different ideas. But there’s a wide variety of ways to approach any problem, whether it’s roof collapse or crop production. Spatial science is exciting to me because people can see something and know what it means. They don’t need to have any training to interpret what pressure sensors mean or need to be up there actually taking like physical measurements all the time.”
Sproles agreed, emphasizing the inherent benefits in finding geospatial solutions to issues that might not seem, at first glance, like geospatial problems.
“GIS isn’t about making maps, and it’s not about data,” he said. “It’s about trying to understand problems and trying to find solutions to those problems. We aren’t just making maps of snow depth. We’re trying to address the structural challenges that are reality of living in a cold, snowy place.”